Data Carpentry: R for data analysis and visualization of Ecological Data
Alistair Bailey, based upon lessons created by François Michonneau & Auriel Fournier
Motivation
Data Carpentry’s aim is to teach researchers basic concepts, skills, and tools for working with data so that they can get more done in less time, and with less pain. The lessons below are based upon using ecology data in R, and this is an introduction to R designed for participants with no programming experience.
A typical data science project looks something like this:
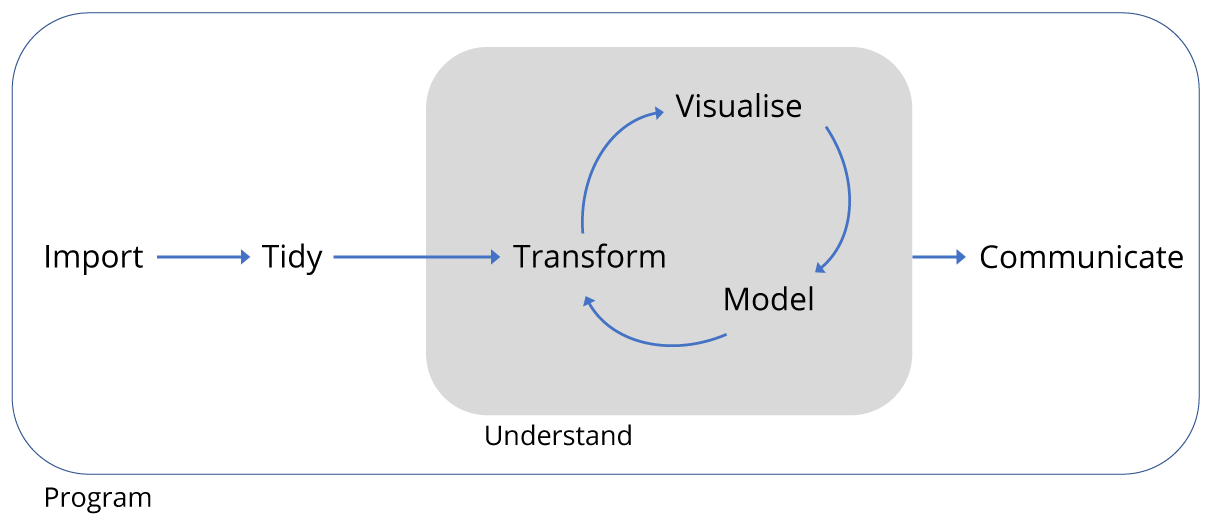
The overall aim is to understand and communicate findings from our data, but this is preceded by the fundamental tasks of importing, tidying and often transforming the data. Transformation means for example, selecting a subset of the data to work with, or calculating the mean of a set of observations.
This entire process can be encompased within a single programming language. Here we will be using R, but Python and other programming languages can acheive the same thing.
These lessons are designed to be taught in a day, and cover only a fraction of what is possible, but will help you take your first steps towards managing your own data projects.
The lessons start with an overview of R and the RStudio interface and introduce visualising data as the first tool for generating insights.
Data is rarely provided in the form we need, so the next set of tools we’ll learn about are those for transforming data.
Armed with these tools, we’ll tackle an ecology dataset from desert rodent surveys as a case study for importing CSV files, performing some basic transformations, and then visualising the data. By the end of this process we should be able to understand and communicate some general findings obtained from the dataset.
Concretely, using a rodent survey data covering a period a period from 1977 to 1991, we will aim to understand the effect on the populations of small seed eating rodents as a result of the exclusion of larger competitor kangeroo rats. In doing so we will perform tasks common to many data projects irrespective of subject area.
Note:
Much of the material in these lessons is derived from R for data science by Garrett Grolemund and Hadley Wickham. This book contains many more detailed examples and advanced concepts not covered here.
Chapters
Data
Ideally all datasets should come with a codebook describing the contents, structure, and layout of a data collection. This is a text document containing information intended to be complete and self-explanatory for each variable in a data file. As this has not been generated for this data, we will use the description found in the Ecology Data Overiew.
Data files for the lesson are available here: http://dx.doi.org/10.6084/m9.figshare.1314459
We will download the combined.csv file during the lesson.
Requirements
Data Carpentry’s teaching is hands-on, so participants are encouraged to use their own computers to ensure the proper setup of tools for an efficient workflow. These lessons assume no prior knowledge of the skills or tools, but working through this lesson requires working copies of the software described below. To most effectively use these materials, please make sure to download the data and install everything before working through this lesson.
Setup instructions
R and RStudio are separate downloads and installations. R is the underlying statistical computing environment, but using R alone is no fun. RStudio is a graphical integrated development environment (IDE) that makes using R much easier and more interactive. You need to install R before you install RStudio. After installing both programs, you will need to install the tidyverse package from within RStudio. Follow the instructions below for your operating system, and then follow the instructions to install tidyverse. More about the tidyverse.
Windows
If you already have R and RStudio installed
- Open RStudio, and click on “Help” > “Check for updates”. If a new version is available, quit RStudio, and download the latest version for RStudio.
- To check which version of R you are using, start RStudio and the first thing that appears in the console indicates the version of R you are running. Alternatively, you can type
sessionInfo(), which will also display which version of R you are running. Go on the CRAN website and check whether a more recent version is available. If so, please download and install it. You may also want to consider removing your old version of R. You can check here for more information.
If you don’t have R and RStudio installed
- Download R from the CRAN website.
- Run the
.exefile that was just downloaded - Go to the RStudio download page
- Under Installers select RStudio x.yy.zzz - Windows XP/Vista/7/8 (where x, y, and z represent version numbers)
- Double click the file to install it
- Once it’s installed, open RStudio to make sure it works and you don’t get any error messages.
MacOS X
If you already have R and RStudio installed
- Open RStudio, and click on “Help” > “Check for updates”. If a new version is available, quit RStudio, and download the latest version for RStudio.
- To check the version of R you are using, start RStudio and the first thing that appears on the terminal indicates the version of R you are running. Alternatively, you can type
sessionInfo(), which will also display which version of R you are running. Go on the CRAN website and check whether a more recent version is available. If so, please download and install it. You may also want to consider removing your old version of R. You can check here for more information.
If you don’t have R and RStudio installed
- Download R from the CRAN website.
- Select the
.pkgfile for the version of OS X that you have and the file will download - Double clik on the downloaded file to install R
- Go to the RStudio download page
- Under Installers select RStudio x.yy.zzz - Mac OS X 10.6+ (64-bit) (where x, y, and z represent version numbers)
- Double click the file to install RStudio
- Once it’s installed, open RStudio to make sure it works and you don’t get any error messages.
Linux
- Follow the instructions for your distribution from CRAN, they provide information to get the most recent version of R for your distribution. For most distributions, you could use your package manager (e.g., for Debian/Ubuntu run
sudo apt-get install r-base, and for Fedorasudo yum install R), but the versions provided by this approach are usually out of date. In any case, make sure you have at least R 3.3.1 - Go to the RStudio download page
- Under Installers select the version that matches your distribution, and install it with your preferred method (e.g., with Debian/Ubuntu
sudo dpkg -i rstudio-x.yy.zzz-amd64.debat the terminal). - Once it’s installed, open RStudio to make sure it works and you don’t get any error messages.
For everyone
After installing R and RStudio, you need to install the “tidyverse” packages. More about the tidyverse.
- After starting RStudio, at the console type:
install.packages("tidyverse")
If you receive a message that the tidyverse pacakge is not available, you will need to install the latest version of R from the CRAN website. See above notes.
Contributors
The list of contributors to this lesson is available here.
Data Carpentry, 2017.
License. Questions? Feedback?
Please file
an issue on GitHub.
On Twitter: @datacarpentry