R and RStudio
Alistair Bailey and Data Carpentry contributors
Learning Objectives
After completing this module, the learner will:
- Know what R is and the the relationship between R and RStudio.
- Navigate and set-up the RStudio interactive development envrionment.
- Have created a R project for this workshop.
- Have used the built-in RStudio help interface to search for more information on R functions.
- Know best practices for seeking help with R on-line.
“There are only two kinds of languages: the ones people complain about and the ones nobody uses”
Bjarne Stroustrup
What are R and RStudio?
R is a programming language that follows the philosophy laid down by it’s predecessor S. The philosophy being that users begin in an interactive environment where they don’t consciously think of themselves as programming. It was created in 1993, and in 1996 it was documented in a paper entitled:
Ross Ihaka and Robert Gentleman. R: A language for data analysis and graphics. Journal of Computational and Graphical Statistics, 5(3):299–314, 1996
Reasons R has become popular include that it is both open source and cross platform, and that it has broad functionality, from the analysis of data and creating powerful graphical visualisations and web apps.
Like all languages though it has limitations, for example the syntax is initially confusing.
An environment is where we bring our data to work with it. Here we work in a R envrionment, using the R language as a set of tools. RStudio is an integrated development environment, or IDE for R programming. It is regularly updated, and upgrading enables access to the latest features.
The latest version can be downloaded here: http://www.rstudio.com/download
Why learn R, or any language ?
We can write R code without saving it, but it’s generally more useful to write and save our code as a script. Working with scripts makes the steps you used in your analysis clear, and thecode you write can be inspected by someone else who can give you feedback and spot mistakes.
Learning R (or any programming language) and working with scripts forces you to have deeper understanding of what you are doing, facilitates your learning and comprehension of the methods you use:
- Writing and publishing code is important for reproducible resarch
- R has many thousands of packages covering many disciplines.
- R can work with many types of data.
- They is a large R community for development and support.
- Using R gives you control over your figures and reports.
Finding your way around RStudio
Let’s begin by learning about RStudio, the Integrated Development Environment (IDE).
We will use R Studio IDE to write code, navigate the files found on our computer, inspect the variables we are going to create, and visualize the plots we will generate. R Studio can also be used for other things (e.g., version control, developing packages, writing Shiny apps) that we don’t have time to cover during this workshop.
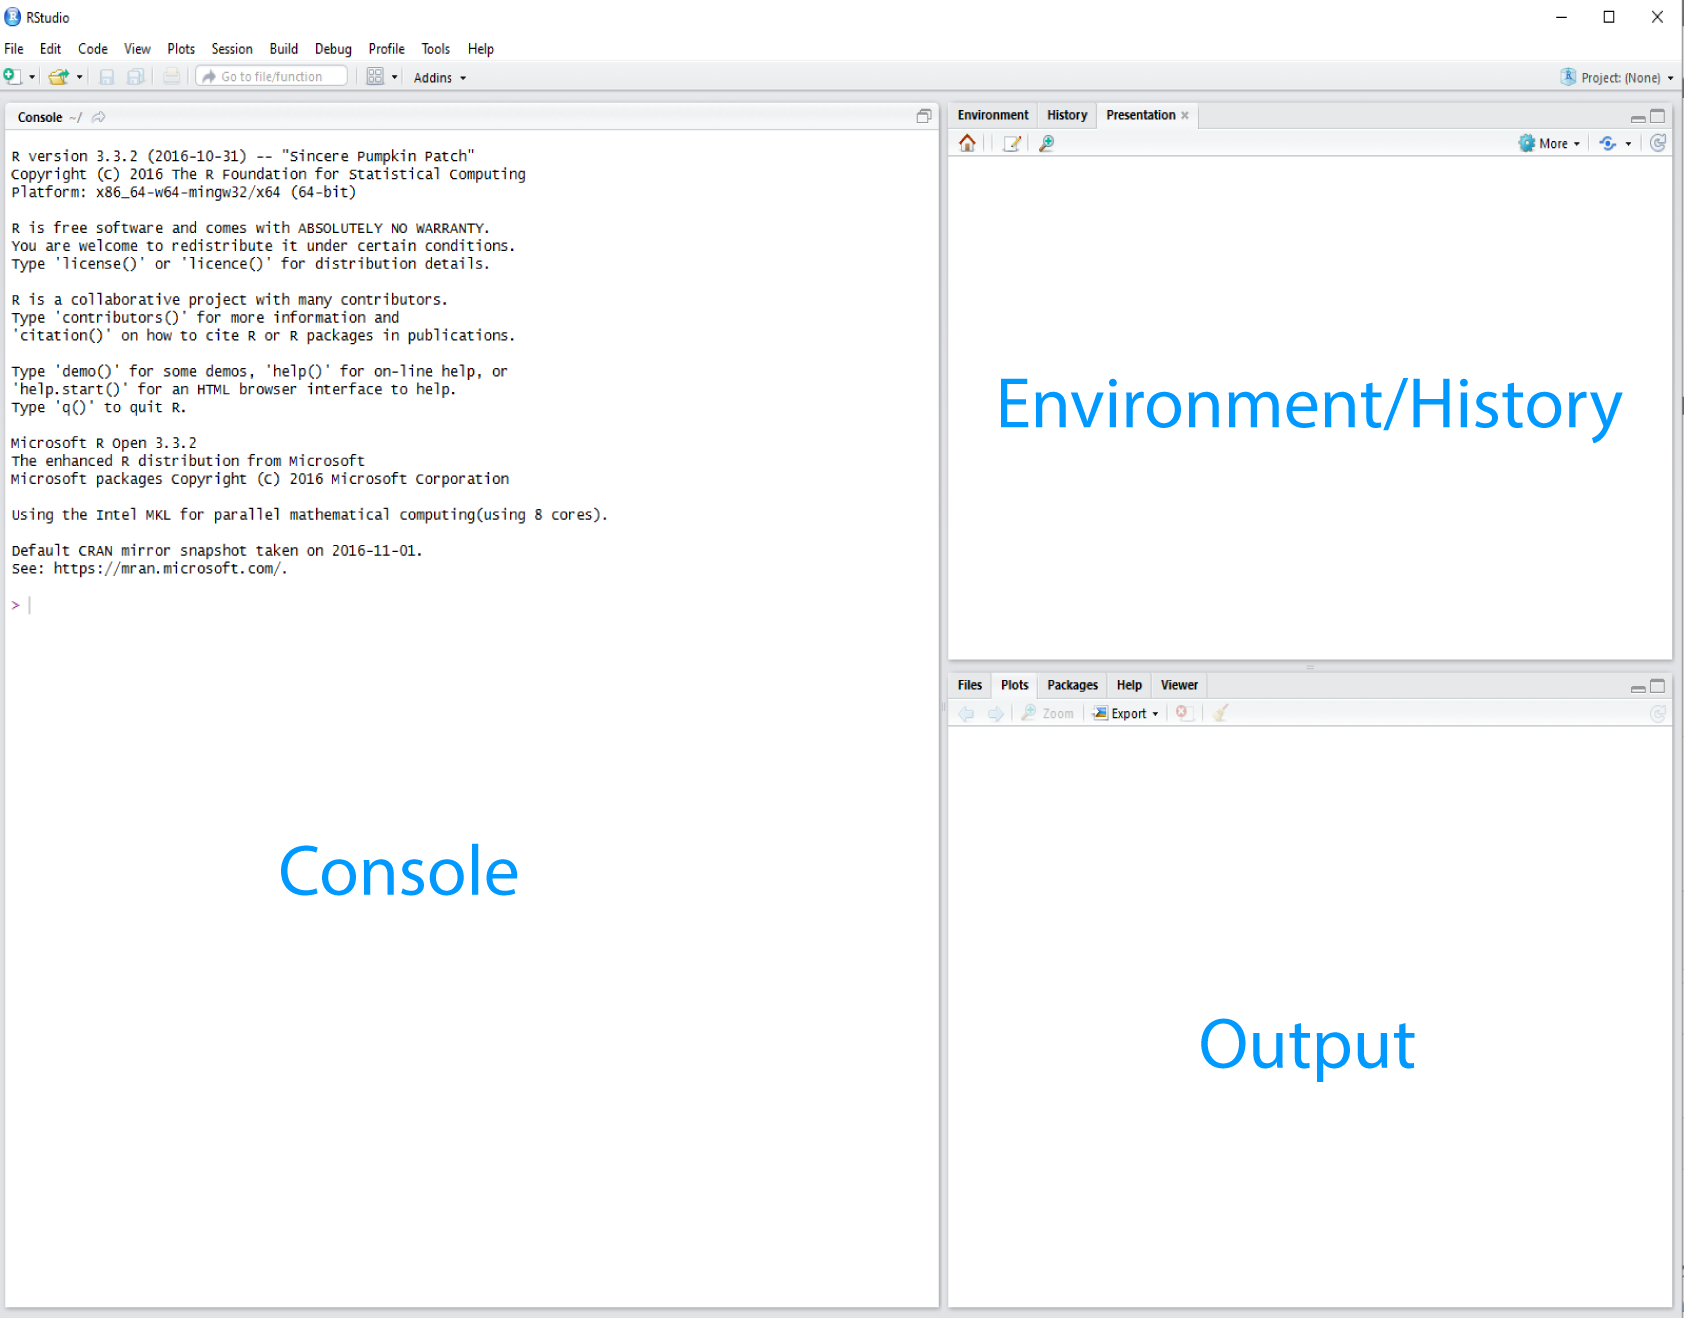
RStudio interface screeshot
R Studio is divided into “Panes”. When you first open it, there are three panes, the console where you type commands, your environment/history (top-right), and your files/plots/packages/help/viewer (bottom-right).
The enivronment shows all the R objects you have created or are using, such as data you have imported.
The output pane can be used to view any plots you have created.
Not opened at first start up is the fourth default pane: the script editor pane, but this will open as soon as we create/edit a R script (or many other document types). The script editor is where will be typing much of the time.
The placement of these panes and their content can be customized (see menu, R Studio -> Tools -> Global Options -> Pane Layout). One of the advantages of using R Studio is that all the information you need to write code is available ina single window. Additionally, with many shortcuts, auto-completion, and highlighting for the major file types you use while developing in R, R Studio will make typing easier and less error-prone.
What is real?
At the start, we might consider our environment “real” - that is to say the objects we’ve created/loaded and are using are “real”. But it’s much better in the long run to consider our scripts as “real” - our scripts are where we write down the code that creates our objects that we’ll be using in our environment.
As a script is a document, it is reproducible
Or to put it another way: we can easily recreate an environment from our scripts, but not so easily create a script from an enivronment.
To support this notion of thinking in terms of our scripts as real, we recommend turning off the preservation of workspaces between sessions by setting the Tools > Global Options menu in R studio as shown:
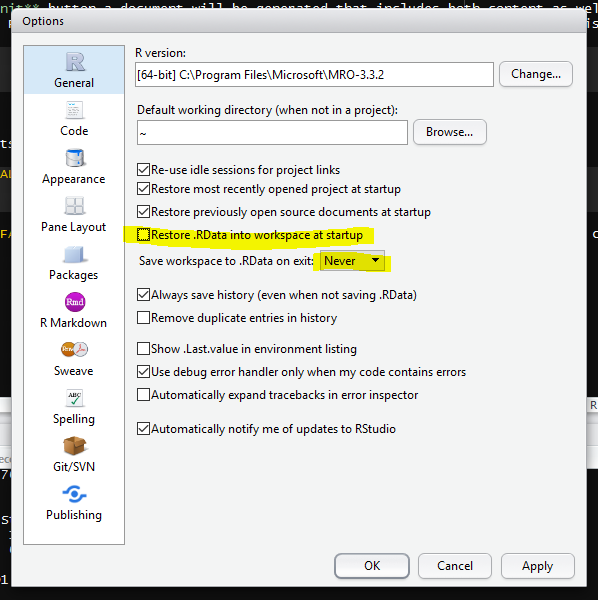
Turning off workspace saving and restoration
We’ll learn more about scripts as we go along.
Where am I?
R studio tells you where you are in terms of directory address like so:
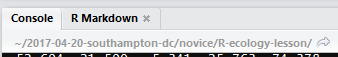
Working directory
If you are unfamiliar with how computers structure folders and files, then consider a tree with a root from which the trunk extends and branches divide. In the image above, the ~ symbol represents a contraction of the path from the root to the ‘home’ directory (in Windows this is ‘Documents’) and then the forward slashes are the branches. (Note: Windows uses backslashes, Unix type systems and R use forwardslashes).
It is good practice to keep a set of related data, analyses, and text self-contained in a single folder, called the working directory. All of the scripts within this folder can then use relative paths to files that indicate where inside the project a file is located (as opposed to absolute paths, which point to where a file is on a specific computer). Working this way makes it a lot easier to move your project around on your computer and share it with others without worrying about whether or not the underlying scripts will still work.
Example of a working directory structure
R projects
RStudio also has a facility to keep all files associated with a particular analysis together called a project.
Creating a project creates a working directory for you and also remembers its location (allowing you to quickly navigate to it) and optionally preserves custom settings and open files to make it easier to resume work after a break.
R Projects
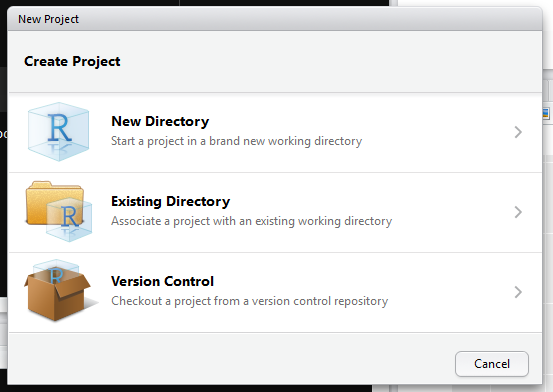
Below, we will go through the steps for creating an “R Project” for this tutorial.
- Start R Studio (presentation of R Studio -below- should happen here)
- Under the
Filemenu, click onNew project, chooseNew directory, thenEmpty project - Enter a name for this new folder (or “directory”, in computer science), and choose a convenient location for it. This will be your working directory for the rest of the day (e.g.,
~/data-carpentry) - Click on “Create project”
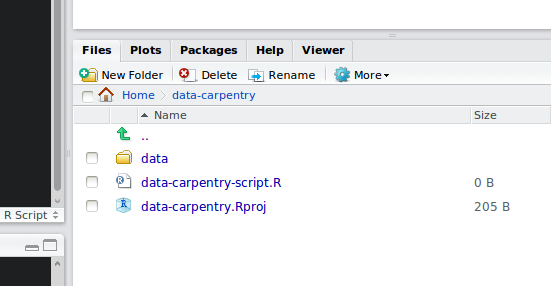
- Under the
Filestab on the right of the screen, click onNew Folderand create a folder nameddatawithin your newly created working directory. (e.g.,~/data-carpentry/data) - Create a new R script (File > New File > R script) and save it in your working directory (e.g.
data-carpentry-script.R)
Your working directory should now look like this:
How it should look like at the beginning of this lesson
Organizing your working directory
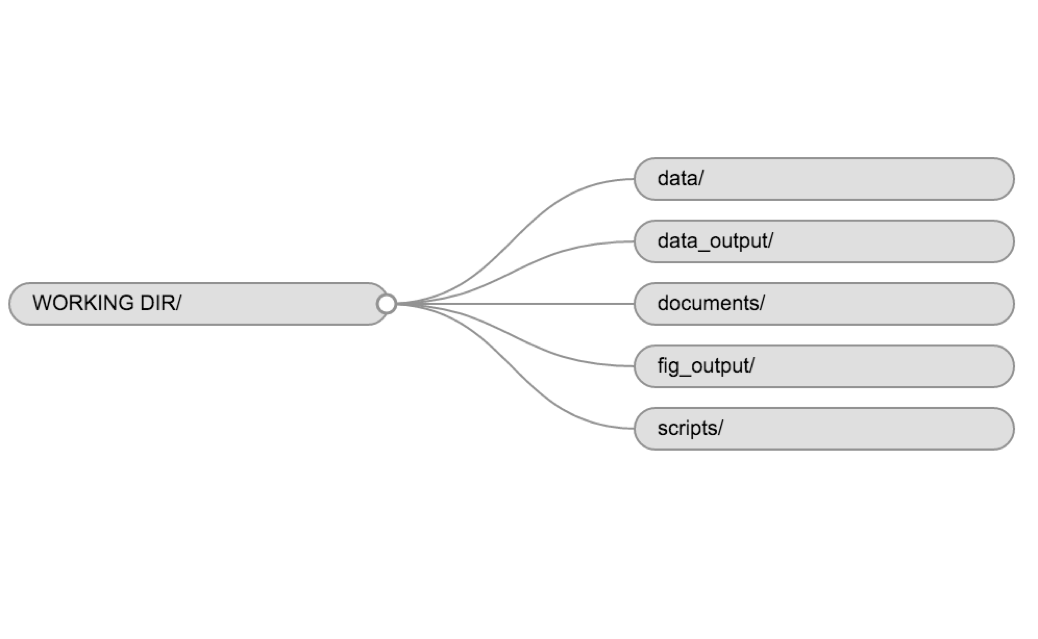
Using a consistent folder structure across your projects will help keep things organized, and will also make it easy find/file things in the future. This can be especially helpful when you have multiple projects. In general, you may create directories (folders) for scripts, data, and documents.
data/Use this folder to store your raw data and intermediate datasets you may create for the need of a particular analysis. For the sake of transparency and provenance, you should always keep a copy of your raw data accessible and do as much of your data clean-up and preprocessing programmatically (i.e. with scripts, rather than manually) as possible. Separating raw data from processed data is also a good idea. For example, you could have filesdata/raw/tree_survey.plot1.txtand...plot2.txtkept separate from adata/processed/tree.survey.csvfile generated by thescripts/01.preprocess.tree_survey.Rscript.documents/This would be a place to keep outlines, drafts, and other text.scripts/This would be the location to keep your R scripts for different analyses or plotting, and potentially a separate folder for your functions (more on that later).
You may want additional directories or subdirectories depending on your project needs, but these should form the backbone of your working directory. For this workshop, we will need a data/ folder to store our raw data, and we will create later a data_output/ folder when we learn how to export data as CSV files.
Seeking help
I know the name of the function I want to use, but I’m not sure how to use it
If you need help with a specific function, let’s say barplot(), you can type:
?barplotIf you just need to remind yourself of the names of the arguments, you can use:
args(lm)I want to use a function that does X, there must be a function for it but I don’t know which one…
If you are looking for a function to do a particular task, you can use help.search() function, which is called by the double question mark ??. However, this only looks through the installed packages for help pages with a match to your search request
??kruskalIf you can’t find what you are looking for, you can use the rdocumention.org website that searches through the help files across all packages available.
A Google or internet search “R <task>” will often either send you to the appropriate package documentation or a helpful forum question that someone else already asked, such as Stack Overflow.
Asking for help
The key to get help from someone is for them to grasp your problem rapidly. You should make it as easy as possible to pinpoint where the issue might be.
Try to use the correct words to describe your problem. For instance, a package is not the same thing as a library. Most people will understand what you meant, but others have really strong feelings about the difference in meaning. The key point is that it can make things confusing for people trying to help you. Be as precise as possible when describing your problem.
If possible, try to reduce what doesn’t work to a simple reproducible example. If you can reproduce the problem using a very small data.frame instead of your 50,000 rows and 10,000 columns one, provide the small one with the description of your problem. When appropriate, try to generalize what you are doing so even people who are not in your field can understand the question. For instance instead of using a subset of your real dataset, create a small (3 columns, 5 row) generic one. For more information on how to write a reproducible example see this article by Hadley Wickham.
To share an object with someone else, if it’s relatively small, you can use the function dput(). It will output R code that can be used to recreate the exact same object as the one in memory:
dput(head(iris)) # iris is an example data.frame that comes with R## structure(list(Sepal.Length = c(5.1, 4.9, 4.7, 4.6, 5, 5.4),
## Sepal.Width = c(3.5, 3, 3.2, 3.1, 3.6, 3.9), Petal.Length = c(1.4,
## 1.4, 1.3, 1.5, 1.4, 1.7), Petal.Width = c(0.2, 0.2, 0.2,
## 0.2, 0.2, 0.4), Species = structure(c(1L, 1L, 1L, 1L, 1L,
## 1L), .Label = c("setosa", "versicolor", "virginica"), class = "factor")), .Names = c("Sepal.Length",
## "Sepal.Width", "Petal.Length", "Petal.Width", "Species"), row.names = c(NA,
## 6L), class = "data.frame")If the object is larger, provide either the raw file (i.e., your CSV file) with your script up to the point of the error (and after removing everything that is not relevant to your issue). Alternatively, in particular if your questions is not related to a data.frame, you can save any R object to a file:
saveRDS(iris, file="/tmp/iris.rds")The content of this file is however not human readable and cannot be posted directly on Stack Overflow. It can however be sent to someone by email who can read it with this command:
some_data <- readRDS(file="~/Downloads/iris.rds")Last, but certainly not least, always include the output of sessionInfo() as it provides critical information about your platform, the versions of R and the packages that you are using, and other information that can be very helpful to understand your problem.
sessionInfo()## R version 3.3.2 (2016-10-31)
## Platform: x86_64-w64-mingw32/x64 (64-bit)
## Running under: Windows 10 x64 (build 14393)
##
## locale:
## [1] LC_COLLATE=English_United Kingdom.1252
## [2] LC_CTYPE=English_United Kingdom.1252
## [3] LC_MONETARY=English_United Kingdom.1252
## [4] LC_NUMERIC=C
## [5] LC_TIME=English_United Kingdom.1252
##
## attached base packages:
## [1] stats graphics grDevices utils datasets methods base
##
## other attached packages:
## [1] RevoUtilsMath_10.0.0
##
## loaded via a namespace (and not attached):
## [1] backports_1.0.5 magrittr_1.5 RevoUtils_10.0.2 rprojroot_1.2
## [5] tools_3.3.2 htmltools_0.3.5 yaml_2.1.14 Rcpp_0.12.9
## [9] stringi_1.1.2 rmarkdown_1.3 knitr_1.15.1 stringr_1.2.0
## [13] digest_0.6.12 evaluate_0.10Data Carpentry, 2017.
License. Questions? Feedback?
Please file
an issue on GitHub.
On Twitter: @datacarpentry