Introduction
Overview
Teaching: 10 min
Exercises: 0 minQuestions
What are the basic principles for using spreadsheets for good data organisation?
Objectives
Describe best practices for organising data so that computers can make the best use of it for data analysis.
Spreadsheet programs
Good data organisation is the foundation of any research project that relies on data analysis - it is of paramount importance to get this first step right in order to avoid time-consuming “data wrangling” and “data cleaning” further down the line. Most researchers have data in spreadsheets or use spreadsheets for data entry. Spreadsheet programs are good for data entry and provide very useful graphical interfaces for handling basic data quality control functions. Spreadsheets can provide a lot of functionality that researchers need:
- Data entry
- Organising data
- Subsetting and sorting data
- Statistics
- Plotting
Many spreadsheet programs are available. Most researchers utilise Excel as their primary spreadsheet program (this lesson will make use of Excel examples), but free spreadsheet programs exist, including LibreOffice, Gnumeric, OpenOffice.org or Google Spreadsheets. Commands may differ a bit between programs, but the general idea is the same.
What’s wrong with spreadsheets?
The intricacies of spreadsheets make it hard to reproduce analysis and very difficult to spot and correct errors. Sometimes this is due to human error (you will learn how to avoid some of them); at other times it is due to the spreadsheet program itself: how many times have you accidentally done something in a spreadsheet that caused a problem (or just made you frustrated)? You are not alone! For example, 20% of genetics papers contain errors due to Excel converting gene names to calendar dates.
- Data analysis in spreadsheets requires a lot of manual work. If you change a parameter or want to use a new dataset, you have to reproduce every action by hand or meticulously copy all the formulas to a new spreadsheet. This is laborious and error-prone. (You can shortcut some of this work with macros… but see the next point.)
- There is no natural “starting point” for an analysis in a spreadsheet as it can happen in any cell. Some formulas depend on formulas in other cells being evaluated and values calculated prior to their execution. This makes it difficult to follow, track or reproduce analysis in spreadsheets.
- The reasoning behind the analysis is opaque in spreadsheets, which becomes a problem if someone asks to reproduce your analysis, if you inherit someone else’s spreadsheet, or even if you want to go back to review your own work in a spreadsheet.
- There are better tools for data analysis, e.g. writing a Python or an R script. While these are not error-proof (nothing is!), they are much more readable and easier to analyse, test and verify by yourself and others.
Using spreadsheets for data organisation, entry and cleaning
During this lesson, you will:
- Implement best practices in organising tabular data (that is, data organised in rows and columns)
- Identify and address common formatting mistakes
- Understand approaches for handling dates in spreadsheets
- Utilise basic quality control to validate data on input and limit incorrect data entry
- Learn some features of spreadsheet programs to check your data quality and how to clean your data before importing it into a statistical analysis program
- Learn overall good data organisation practices
Key Points
Good data organisation is the foundation of any research project.
Organising data in spreadsheets
Overview
Teaching: 10 min
Exercises: 15 minQuestions
How do we organise and format data in spreadsheets for effective data use?
Objectives
Describe best practices for data entry and formatting in spreadsheets.
Apply best practices to arrange variables and observations in a spreadsheet.
A common mistake is use a spreadsheet like a lab notebook. In other words, to convey information not just with the data, but with notes in the margin and the spatial layout of the data. We humans can (usually) interpret these things, but computers cannot. They are incredibly literal, so unless we explain every single nuance of meaning that we intended, the computer will misinterpret our data - and that causes problems. This is why it is extremely important to start with well-formatted tables from the outset - before you even start entering data from your first preliminary experiment.
Data organisation is the foundation of your research project. It can make it easier or more difficult to work with your data throughout your analysis. You should start thinking about data organisation before you start collecting data. There’s a lot of flexibility, but some of the choices you make now will limit your ability to work with the data in the future.
Best data formats may differ
The best layout for data entry might change dependent on the specific use case. Do not stick to a format just because you have used it previously. Choose the best format on a case-by-case basis. (And if you need to convert between formats, ideally you would automate the conversion with a script in, say, Python or R.
Structuring data in spreadsheets
The cardinal rule of using spreadsheet programs for data is to keep it “tidy”:
- Put all your variables (i.e. the thing you are measuring, like ‘weight’ or ‘temperature’) in its own column
- Put each observation in its own row
- Do not combine multiple variables in one cell
- Leave the raw data raw - do not change it!
- Export the cleaned data to a text-based format like CSV (comma-separated values). This ensures that anyone can use the data, and is required by most data repositories. We will cover this later in the lesson.
To see some of these rules in action, let’s look at the following data from a survey of small mammals in a desert ecosystem. Different people have gone to the field and entered data into a spreadsheet. They kept track of variables like species, plot, weight, sex and date collected.
Here’s a poor example of data collection:
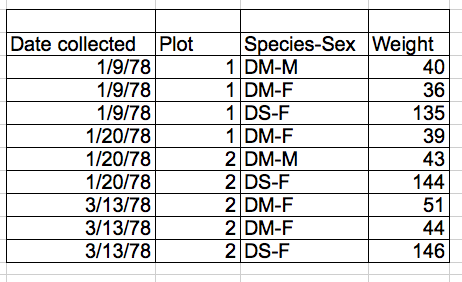
There are problems like the species and sex variables being in the same field. This data format would make it difficult to easily look at all of one species, or look at different weight distributions by sex. If, instead, we put sex and species in different columns, it would be much easier to perform such analyses.
The data could be better organised as:
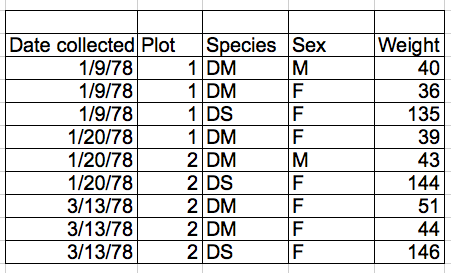
Columns for variables and rows for observations
The rule of thumb, when setting up data in a table is: columns = variables, rows = observations, cells = data values.
Including metadata in the spreadsheet
“Metadata” is the data you record about your data (such as the date the experiment was conducted, who conducted it, etc). It is essential to understanding the circumstances under which your data was collected. You may be on intimate terms with your dataset while you are collecting and analysing it, but this will change over time. After six months, you are unlikely to remember the exact algorithm you used to transform a variable, or that “sglmemgp” means “single member of group”. You don’t need a photographic memory if you collect good metadata.
Your data is important, which means there will be many people who will want to examine it. They will need good metadata if they are to understand your findings, review your submitted publication, replicate your results, design a similar study, or even just want to archive your data. While digital data by definition are machine-readable, understanding their meaning is a job for human beings - and they need the help that metadata provides. The importance of documenting your data during the collection and analysis phase of your research cannot be overstated - it is fundamental.
Metadata should not be contained in the data file itself, because it can disrupt how programs interpret your data file.
Rather, metadata should be stored as a separate file in the same directory as your data file, preferably in plain text
format (i.e. .txt) with a name that clearly associates it with your data file. Because metadata files are free text format,
they allow you to encode comments, units, information about how null values are encoded and related information.
Additionally, file or database level metadata describes how files that make up the dataset relate to each other; what format are they are
in; and whether they supersede or are superseded by previous files. A folder-level README.txt file is the classic way of accounting for
all the files and folders in a project.
Credit: MANTRA
The above text on metadata was adapted from the online course Research Data MANTRA by EDINA and Data Library, University of Edinburgh. MANTRA is licensed under a Creative Commons Attribution 4.0 International License.
Keeping track of your analyses
When you are working with data in spreadsheets, the spreadsheet you end up with will often look very different to the one you started with. With each change, you are losing information about the history of the data. How many times have you needed to roll back an analysis, only to become completely lost when retracing your steps? There are ways of mitigating this problem:
- Before starting your analysis, create a new copy of the original data file to keep alongside your analysed data. This way, you will always be able to check changes against your original dataset and, if the worst comes to the worst, it will be easy to start the analysis again!
- Record the steps you take as you conduct your analysis. You should record these steps as you would any step in an experiment. We recommend that you do this in a plain text file stored in the same folder as the data file.
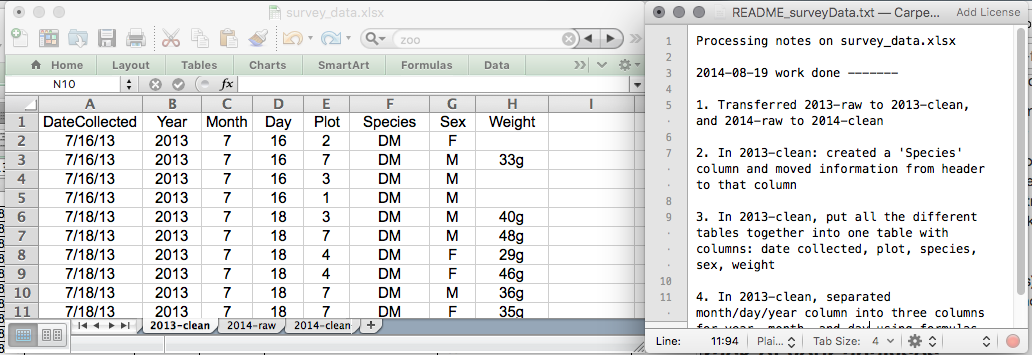
The the following example, the spreadsheet has ‘raw’ tabs in which to store the original, untouched data and ‘clean’ tabs in which the processed data is stored. It is accompanied with a text file that describes the steps that have been taken.
Version controlling your data
Although out of scope for this lesson, you can learn about version control in a separate course, which can be used to record the transformation of your data over time, and provides tools to roll back to any previous version of the data.
Fixing mistakes in data organisation
Let’s put this theory into practice! If you have not already done so, download the messy survey data (as outlined in Setup section). We will now clean this data and learn some best practices in the process.
Take the messy version of the survey data and open it in a spreadsheet program. There are four tabs:
- Two field assistants conducted the surveys, one in 2013 and one in 2014, and they both kept track of the data in their own way in the tabs ‘2013’ and ‘2014’, respectively.
- Ignore the ‘dates’ tab for now, we will come back to it later in the lesson.
- The ‘semi-cleaned-combined’ tab contains combined data from tabs ‘2013’ and ‘2014’. Reproducing this tab is what the exercise is all about. However, we will revisit this tab in episode on quality assurance and control and you will see why it is ‘semi-clean’.
Exercise
The goal of this exercise is to create a cleaned data set in a new tab by combining the data from tabs ‘2013’ and ‘2014’. You will need to identify what is wrong with the way the data is arranged in these two tabs, and then make steps to clean the data before combining it.
Whilst completing this exercise, you might like to contemplate how much time could be have been saved if the researchers had agreed on a data format before the collection took place, and how long it would take to clean real-world research data that could contain many millions of records.
Keep your raw data - raw
Do not forget to create a new file or a new tab for the cleaned data; never modify your original (raw) data.
Solution
All the mistakes in this messy dataset are addressed in the next episode. You can refer to it to check if you spotted them all and go back and fix your spreadsheet.
Full & clean dataset
If you want to have a look at the full, clean dataset - have a look atsome of the other files you downloaded. surveys.csv combines data from all the surveys and combined.csv includes the cleaned data from surveys.csv, plots.csv and species.csv combined into one clean file.
Key Points
Never modify your raw data. Always make a copy before making any changes.
Keep track of all of the steps you take to clean your data in a plain text file.
Organise your data according to tidy data principles.
Record metadata in a separate plain text file (such as README.txt) in your project root folder or folder with data.
Common spreadsheet errors
Overview
Teaching: 10 min
Exercises: 15 minQuestions
What are some common challenges with formatting data in spreadsheets and how can we avoid them?
Objectives
Recognise and resolve common spreadsheet formatting problems.
There are a few potential errors to be on the lookout for in spreadsheet data. If you are aware of the errors, and the complications they can cause on downstream data analysis and result interpretation, it helps motivate you and your project members to try and avoid them. It’s far more efficient to prevent problems by making small changes in the way you collect data, than spending weeks or months cleaning messy data. Ultimately, good organisation of your data in improves your research efficiency and reliability. Here are some common spreadsheet errors, which we will cover in detail below:
- Using multiple tables
- Using multiple tabs
- Not filling in zeros
- Using problematic null values
- Using formatting to convey information
- Using formatting to make the data sheet look pretty
- Placing comments or units in cells
- Entering more than one piece of information in a cell
- Using problematic field names
- Using special characters in data
- Inclusion of metadata within data
- Date formatting
Using multiple tables
A common mistake is creating multiple data tables within a single spreadsheet, as shown below. This will confuse a data analysis program (and many humans too).
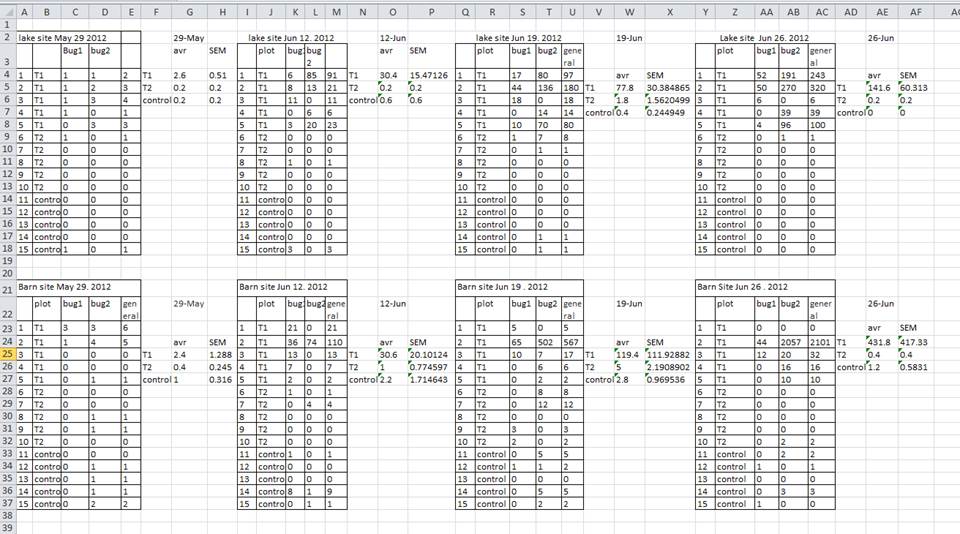
There are a number of problems with multiple tables on one page. The main problem is that - although clearly separate to a human observer - a computer will rigidly interpret anything in the same row as belonging to the same observation.
In the example above, the computer will read row 4 and assume that all columns A-AF refer to the same sample. This row actually represents four distinct samples (sample 1 for each of four different collection dates - May 29th, June 12th, June 19th, and June 26th), as well as some calculated summary statistics (an average (avr) and standard error of measurement (SEM)) for two of those samples.
There is no reason why observations from different sites or different years should not go into a single table. You just need to keep track of them by using new columns (in this examples, one for site and one for year). Keeping data from the same experiment in a single table will help you stick to a consistent data structure, and avoid errors when looking up data from different tables.
Using multiple tables on one page also makes it difficult for humans to keep track of the data - especially if one of the tables is hidden off the edge of the spreadsheet. Multiple tables also increases the risk of using the same column name in multiple places, which will make it significantly harder to clean your data.
Using multiple tabs
But what about workbook tabs? Are they the easy solution to organising data? In a word, no!
-
When you create extra tabs, you prevent the computer from seeing connections that exist in the data. Before you can analyse the data, you need to explicitly tell the computer how to combine the data across tabs. If the tabs are inconsistently formatted, you might even have to do this manually, which is inefficient. We used multiple tabs in our example messy data file, and you have now seen how difficult it is to consolidate the data across tabs.
-
Separating your data over multiple tabs means that you are more likely to accidentally add inconsistencies to your data, because it is all too easy to forget to change to the appropriate tab before recording new data. Similarly, when it comes to analysis, it’s easy to draw data from the wrong tab.
Rather than entering data into multiple tabs, try adding another column to your spreadsheet.
Note on bigger data and column headers
Your datasheet might get very long over the course of the experiment. This makes it harder to enter data if you cannot see your headers at the top of the spreadsheet. But do not be tempted to repeat your header row in the middle of your data - these headers will get mixed into the data leading to problems down the road. Instead, you can freeze the column headers so that they remain visible even when you have a spreadsheet with many rows. if you are not sure how to do this, see the documentation on how to freeze column headers in Excel.
Not filling in zeros
Sometimes the thing you are measuring throws out the odd zero - sometimes the observations are almost all zeros. Is it really necessary to keep typing in zeros? Wouldn’t it be more efficient to leave the column blank unless there’s a non-zero?
To a computer, there is a big difference between a zero and a blank cell. A zero is data. A blank cell means that there was no measurement, and the computer will interpret it as an unknown value (otherwise known as a null value).
Spreadsheets are likely to misinterpret blank cells that you intend to be zeros, and statistical analysis programs are very likely to interpret blank cells. By not entering the value of your observation, you are telling your computer to represent that data as unknown or missing (null). This can cause problems with later analysis. To take a simple example: the average of a set of numbers which includes a single null value is always null (because the computer cannot guess the value of the missing observations).
It is very important to record zeros as zeros and truly missing data as nulls.
Using problematic null values
Null values are also problematic! Different people take different approaches to recording the lack of data (see below), but not all approaches are useful.
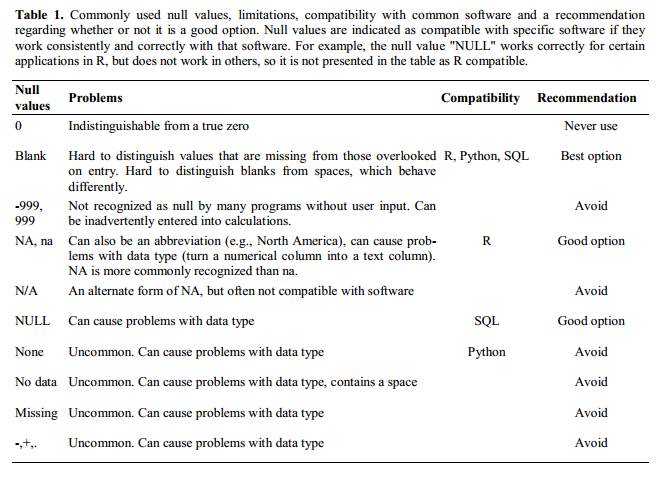
Sometimes different null values are used to describe the different reasons why the observation could not be made. “NULL”, “missing data” and “malfunction”, all convey important information, but you are in effect using a single column to capture three different types of information. This is messy, as described on the previous page, and the solution is to include new columns - one for each type of information you need to capture.
Sometimes unacceptable null values are automatically recorded by the device you use to measure the observation (older devices are especially guilty of not following best practice). If the erroneous null values stem from the measuring device, you’re left with little choice but to clean the data and replace them with a better null value. A tool like OpenRefine, which will be introduced in a later lesson, is perfect for this kind of cleaning.
Whatever the reason, it is a problem if unknown or missing data is recorded as -999, 999, or 0. Statistical programs do not know that these are intended to represent missing (null) values and, because they are valid numbers, they will be included in calculations which will lead to incorrect results. How these values are interpreted will depend on the software you use to analyse your data.
It is essential to use a clearly defined and consistent null indicator. Although open to ambiguity, blanks are still used by a number of applications, but options like and ‘NA’ (for R) and ‘NaN’ (for Python) are good choices. For more information, see White et al. Nine simple ways to make it easier to (re)use your data.
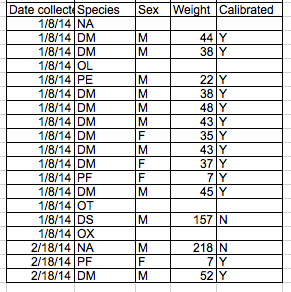
Using formatting to convey information
A common examples of using formatting to convey information is to highlight cells in a sepcific colour that you want dealt with differently to others. For example, highlighting cells that should be excluded from the analysis (see below). Another example is to leave a blank row to indicate a separation in the data. Both of these highlighting approaches will cause problems with later analysis because they are undetectable to computers.
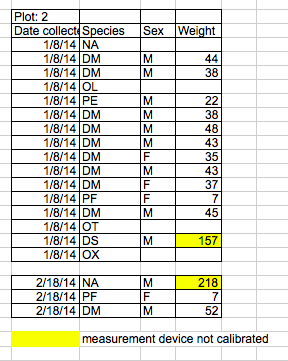
The solution - as is so often the case with spreadsheets - is to create a new column to encode the data that should be excluded.
Using formatting to make the spreadsheet look pretty
It’s very difficult not to tweak your tables to make them look prettier, e.g. merging cells (especially in headers) or using borders to separate different data. If you are not careful, formatting a worksheet to be more aesthetically pleasing can compromise your computer’s ability to see associations in the data. For example, merged cells will confuse statistics software, which will read the merged cell as a single data value and cause misalignment with data in the following rows.
Your primary goal with structuring data is to accurately capture the data and make the connections in the data transparent to yourself and any program you use for analysis. You will want pretty tables for publications and suchlike, but those should be completely separate from the tables you use to record the data.
Placing comments or units in cells
Sometimes you need to make a note or a comment on an observation. For example, you may want to identify observations that were collected by a summer student who you later found out was misidentifying some of your species. These data you will want to identify as suspect.
The problem is the same as that with formatting data to convey information: most analysis software cannot see Excel or LibreOffice comments, so they would be ignored. The solution is the same as described for formatting, create another column if you need to add notes to cells.
Do not include units in cells! They cause a headache in later analysis when you have to separate out the unit from its associated value. Ideally, all the measurements you place in one column should be in the same unit, but if for some reason they are not, create a new column to specify the units.
Entering more than one piece of information in a cell
As described on the previous page, the rule is “one cell, one observation”. For example, if you are counting species and you find one male and one female of the same species, you could enter this as ‘1M, 1F.’ By this stage in the lesson, you will probably find yourself instinctually repelled by this practice! If you record two pieces of data in the same cell, you will confuse data analysis software and this risks mistakes in analysis.
The solution is to include one column for the number of individuals and a separate column for the sex.
Using problematic field names
The key here is to choose descriptive column names to allow for easy data identification.
There is a delicate balance in choosing the correct length of column name. Longer names allow you to adequately describe the data, but they can become unwieldy. It is better to err on the side of a longer, descriptive column name, than a shorter, ambiguous one. You can use abbreviations to reduce the length of column names, but these can quickly become obscure (especially if you don’t return to the data for 6 months or longer). If you use unconventional abbreviations, make sure to keep a record of their full description in the text file you keep with the spreadsheet data.
You must be careful with the characters you use. Do not use spaces, numbers, or special characters of any kind. All of these can cause problems when conducting later analysis. Spaces can be misinterpreted as delimiters (i.e. they can be used by some programs to show where a column begins and ends), some programs do not like field names that are text strings that start with numbers, and some characters (e.g. “/”) can be misinterpreted by data analysis programs.
Instead of spaces, the best advice is to use underscores (_) to separate words. Some people use CamelCase (where
uppercase letters are used to delimit words, e.g. ExampleFileName) but they are more difficult to read and, if you ever
want to return the whitespaces later in your analysis, it is easier to do this with underscore-separated words than
CamelCase.
Where all the observations share the same unit, it can be useful to include the unit in the field name to avoid later confusion. Alternatively, as described above, include the unit in a separate column.
The table below gives some examples of best practice in naming:
| Good Name | Good Alternative | Avoid | Reason to avoid |
| Max_temp_C | MaxTempC | Maximum Temp (°C) | Uses a special character (°) |
| Precipitation_mm | Precipitation | precmm | Not very readable |
| Mean_year_growth | MeanYearGrowth | Mean growth/year | Uses a special character (/) |
| sex | sex | M/F | Uses special character (/) and not very readable |
| weight | weight | w. | Uses a special character (.) and not very readable |
| cell_type | CellType | Cell Type | Uses a blank character |
| Observation_01 | first_observation | 1st Obs | Uses a blank character and starts with a number |
Using special characters in data
Do not use your spreadsheet as a word processor! If you copy text directly from a Microsoft Word (or similar applications), you are likely to include lots of formatting information (e.g. tabs, line breaks, etc.) and fancy non-standard characters (left- and right-aligned quotation marks, em-dashes, etc.) that will confuse data analysis software.
Best practice is to avoid adding anything other than text and spaces into a cell.
Inclusion of metadata within data
We have already learned that metadata is the data you record about your data - how the data was collected and organised. This is just to reiterate that metadata should not be contained within the data itself. So, you should explain comments, units, information about how null values are encoded and all other information relevant to your data in a separate file in the same folder as your data or a separate tab within your data spreadsheet.
Fixing mistakes in data organisation
Let’s put this theory into practice! If you have not already done so, download the messy survey data (as outlined in Setup section). We will now clean this data and learn some best practices in the process.
Take the messy version of the survey data and open it in a spreadsheet program. There are four tabs:
- Two field assistants conducted the surveys, one in 2013 and one in 2014, and they both kept track of the data in their own way in the tabs ‘2013’ and ‘2014’, respectively.
- Ignore the ‘dates’ tab for now, we will come back to it later in the lesson.
- The ‘semi-cleaned-combined’ tab contains combined data from tabs ‘2013’ and ‘2014’. Reproducing this tab is what the exercise is all about. However, we will revisit this tab in episode on quality assurance and control and you will see why it is ‘semi-clean’.
Exercise
The goal of this exercise is to create a cleaned data set in a new tab by combining the data from tabs ‘2013’ and ‘2014’. You will need to identify what is wrong with the way the data is arranged in these two tabs, and then make steps to clean the data before combining it.
Whilst completing this exercise, you might like to contemplate how much time could be have been saved if the researchers had agreed on a data format before the collection took place, and how long it would take to clean real-world research data that could contain many millions of records.
Keep your raw data - raw
Do not forget to create a new file or a new tab for the cleaned data; never modify your original (raw) data.
Solution
When you finish, compare your clean spreadsheet with the structure suggested below or with surveys.csv which is the example cleaned data file you downloaded during setup. For example, you could chose to record your data using the following columns:
- date_collected
- plot_id species_id
- sex
- hindfoot_length_cm
- weight_grams
- scale_calibrated
- comments
Your cleaned spreadsheet might not be identical to either of the above, but it should have a similar overall structure. We will address the reasoning behind separating date components in 3 separate columns in surveys.csv in the next episode on formatting dates in spreadsheets.
Full & clean dataset
If you want to have a look at the full, clean dataset - have a look atsome of the other files you downloaded. surveys.csv combines data from all the surveys and combined.csv includes the cleaned data from surveys.csv, plots.csv and species.csv combined into one clean file.
Key Points
Avoid using multiple tables within one spreadsheet.
Avoid spreading data across multiple tabs.
Record zeros as zeros.
Use an appropriate null value to record missing data.
Do not use formatting to convey information or to make your spreadsheet look pretty.
Place comments in a separate column.
Record units in column headers.
Include only one piece of information in a cell.
Avoid spaces, numbers and special characters in column headers.
Avoid special characters in your data.
Dates as data
Overview
Teaching: 10 min
Exercises: 15 minQuestions
What are good approaches for handling dates in spreadsheets?
Objectives
Describe how dates are stored and formatted in spreadsheets.
Describe the advantages of alternative date formatting in spreadsheets.
Demonstrate best practices for entering dates in spreadsheets.
Dates are the scourge of spreadsheets! They are the cause of a huge number of problems with misinterpreted data.
When working with data, the goal is to remove, as much as humanly possible, any ambiguity. But ambiguity can creep into your dates when there are regional variations (e.g. UK vs. US data formats), or if different software products (e.g., LibreOffice, Microsoft Excel, Gnumeric) are used. Ambiguity also arises when spreadsheet programs attempt to “help” you, for example by filling in what it believes is the missing year in the date you expected to only include a day and a month.
Additionally, Excel can turn things that are not dates into dates, for example names or identifiers like MAR1, DEC1, OCT4. Recently, scientists had to rename human genes to stop Microsoft Excel from misreading them as dates, as it was estimated that 20% genetics research papers contained errors!
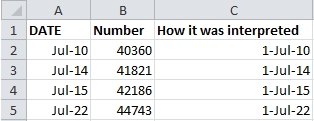
The image below demonstrates some of the many date formatting options available in Excel.
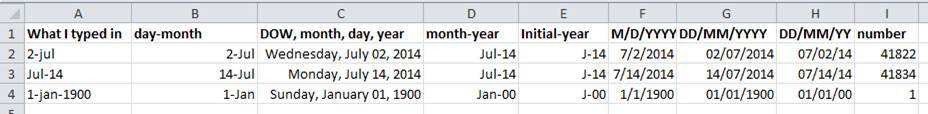
With such a bewildering array of date formats, combined with the fact that many real-world data sets are built up over time by different people, using different programs, all of whom may be making different assumptions, it becomes difficult to believe that the dates in any sizeable dataset can be accurate! Fortunately, there is a solution. The best route to unambiguously storing dates is to use separate columns for the day, month and year. Before we get to this solution, let’s first investigate some of the major issues with how dates are stored in spreadsheets.
Dates stored as integers
We have seen that Excel displays dates in many different formats, but it stores dates for its own purposes in only one format: a number. This number represents how many days have elapsed since 31 December 1899 (the reason for this is disconcertingly long-winded and quirky). It means 1 January 1900 is stored as number 1, 2 January 1900 is stored as number 2, and so on. In the example above, 2 July 2014 is stored as the number 41822.
Storing dates as a number has some advantages: it’s easy to add days to a given date using simple arithmetic. If you had a plan to conduct interviews every ninety days, you could type:
=B2+90
And Excel would return:
30-Sep
In most cases, it retains the format of the cell that is being operated upon. Month and year rollovers are internally tracked and applied.
However, there is also a significant problem with this system, which is that Excel refuses to believe that dates existed before 31 December 1899. Open a spreadsheet and add the following to the A1 cell:
1 January 1900
Now move to a new cell and enter:
=A1+2
Excel will provide the answer 3 January 1900 (in some format) because the result of this arithmetic returns a date 2 days after 1 January 1900. Now try removing 2 days. Move to another cell and enter:
=A1-2
Excel returns an error, because it is incapable of understanding that dates existed prior to 1 January 1900. This poses a huge problem for storing historical data!
Note on adding and subtracting dates and times
Adding months and years to a date is slightly trickier than adding days because we need to make sure that we are adding the amount to the correct entity (i.e. month or year). To do so,
- first we need to extract single entities (day, month or year) from the date (how to do that is explained below),
- then, we can add values to each entity (e.g. month or year),
- finally, we need to reconstruct the date from the updated day, month, year entities using the
DATE()function.Times are handled in a similar way; seconds can be directly added, but to add hours and minutes we need to make sure that we are adding the quantities to the correct entities. Extracting seconds, minutes and hours from a time is explained in one of the exercises below.
Excel’s date systems on Macs
In the past, Excel used to entertain a second date system, the 1904 date system, as the default in Excel for Macs. This system assigns a different serial number to dates than the 1900 date system (i.e. it starts counting time from 1 January 1904). Because of this, there were accuracy issues with dates when exporting data from Excel between Macs and PCs (dates were off by 4 years and 1 day). Luckily, Excel for Macs now defaults to the 1900 date system and supports dates as early as January 1, 1900.
Regional date formatting issues
Different countries write dates differently. If you are in the UK, you will interpret 7/12/88 as the 7th of December 1988. A researcher in the US will interpret the same entry as the 12th of July 1988. This regional variation is handled automatically by your spreadsheet program through a setting in the preferences. Errors are easily added to your spreadsheet if your preferences are set incorrectly or, more likely, if you share a spreadsheet with a person from a country that uses a different date format. It is especially devastating if only some of the date formats are changed, which leaves you with a spreadsheet full of ambiguous dates and no way to repair them.
Exercise
Look at the tab ‘dates’ in the messy data spreadsheet you used in previous exercises. It contains a copy of the ‘plot 3’ table from the ‘2014’ tab (this is the table that contains the problematic dates). You will notice that there are years missing from the “Date collected” column. Just by looking at the entered dates, can you figure out the date format that was used?
Solution
The date format is ‘MM/DD/YYYY’ because we have entries like ‘2/19’ and ‘5/18’, which means that the person who entered these dates most probably used the US version of Excel where month comes before day. If we did not have such entries, we would not be able to tell what date was entered! For example, is ‘7/11’ ‘7th November’ or ‘11th July’?
Issues with missing bits of dates
If you miss out some part of a date - spreadsheet programmes such as Excel will do their best to guess and form a valid date (so they can store it properly internally) from your partial information. This will happen automatically and often without you even noticing, but can cause you some headache down the line.
Dates with no year
If no year is specified, the spreadsheet program will assume you mean the current year and will insert that value. This may be incorrect if you are working with historical data so be very cautious when working with data that does not have a year specified within its date variable.
Exercise
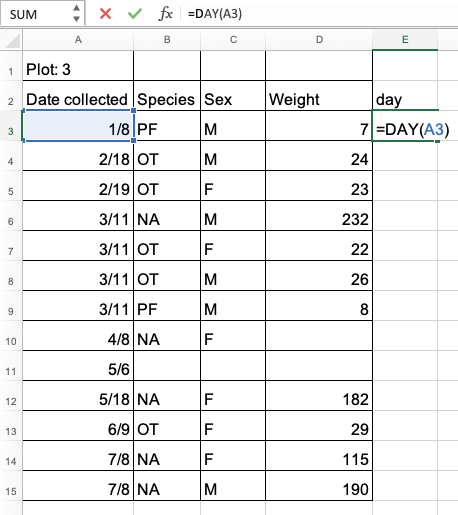
Look at the tab ‘dates’ in the messy data spreadsheet. It contains a copy of the ‘plot 3’ table from the ‘2014’ tab (this is the table that contains the problematic dates). Select one of the cells in “Date collected” column, for example cell ‘A3’. What is the date Excel thinks is entered? What is the year of the date?
Solution
Select any cell in “Date collected” column. In the field for the cell formula at the top, Excel will display the value that is stored > > internally for this cell.
From the cell that is selected in the figure above, we can see that Excel has stored the date “08/01/2015” (i.e. 8 January 2015 using the DD/MM/YYYY format). This data was meant to relate to 2014 but Excel has added the year 2015 instead.
The cause of this change is that the field assistant who collected the data initially forgot to add their data for ‘plot 3’ in the dataset. They came back in 2015 to add the missing data into the dataset and entered the dates for ‘plot 3’ as they had been recorded - without the year. Excel automatically interpreted the year as 2015 the year in which the data was entered into the spreadsheet. This exemplifies how easy it is to introduce errors in dates.
Dates with 2-digit year
When you type a date using a 2-digit year number (e.g. “88”), spreadsheet programmes use specific rules to determine which century to use for the date. For example, Excel determines the century by using a cutoff year of “29”, which means that 2-digit years 00-29 will be treated to be in the 21st century (i.e. after 2000), and 2-digit year 30-99 will be treated to be in the 20st century (i.e. after 1900).
Exercise
Type the follwing dates in an Excel spreadsheet:
- 1/1/00
- 1/1/01
- 1/1/29
- 1/1/30
- 1/1/31
- 1/1/99
What year does Excel assumes for each of these dates?
Solution
Excel is using the years 29/30 as the cutoff for the century by default - dates before and including the year “29” will be treated as in the 2000s and year “30” and above in 1900s:
- 1/1/00 = 2000-Jan-1
- 1/1/01 = 2001-Jan-1
- 1/1/29 = 2029-Jan-1
- 1/1/30 = 1930-Jan-1
- 1/1/31 = 1931-Jan-1
- 1/1/99 = 1999-Jan-1
Note on missing bits of dates
Make sure you remove any ambiguity when working with dates (and data in general), so as to avoid situations where spreadsheet programmes are making guesses on what your data should be.
Issues when exporting data containing dates
Exercise
What happens to the dates in the
datestab of the messy spreadsheet if we export this sheet to.csv(Comma–Separated Value format) and then open the file in a plain text editor (like TextEdit or Notepad)? What happens to the dates if we then open the.csvfile back in Excel?Solution
- Click to the
datestab of the messy data spreadsheet.- Select
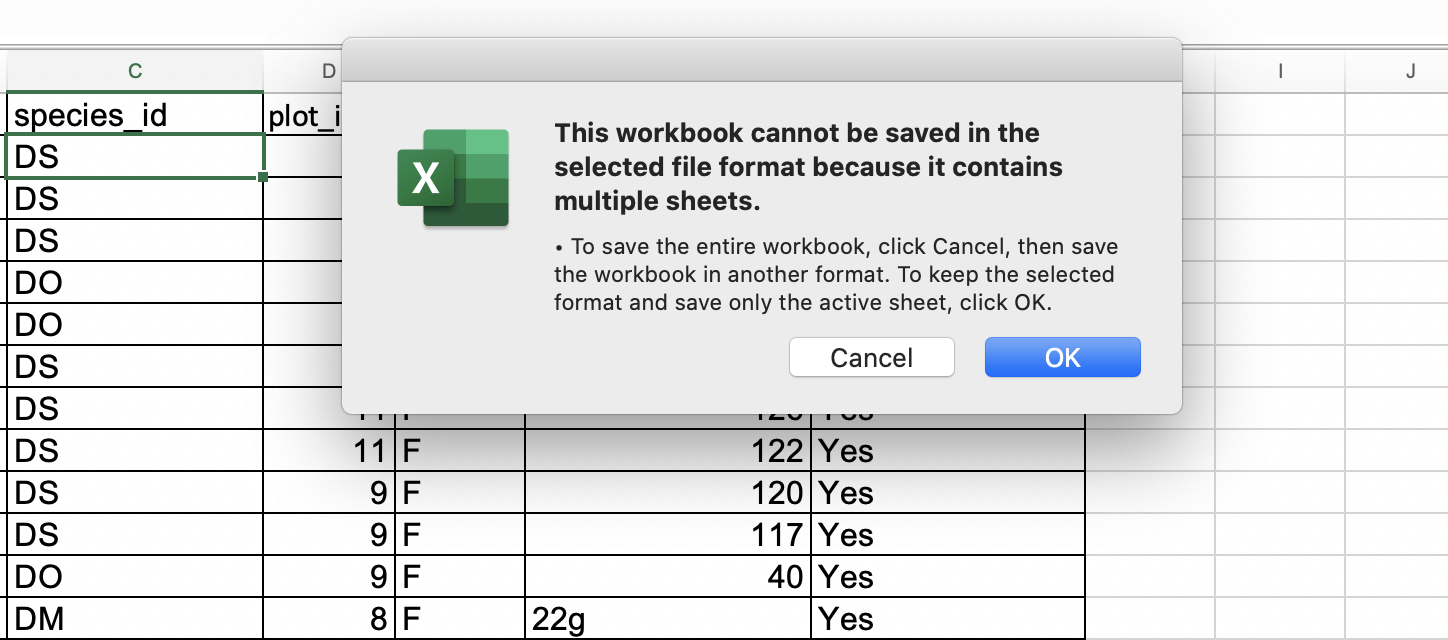
File -> Save Asin Excel and in the drop down menu for file format selectCSV UTF-8 (Comma delimited) (.csv)(orText CSV (.csv)in LibreOffice). Enter a file name, e.g.dates-export.csvand clickSave.- You will see a pop-up that says “This workbook cannot be saved in the selected file format because it contains multiple sheets.” Choose
Save Active SheetorOKdepending on your Excel version (In LibreOffice you will see aConfirm File Formatdialogue: selectUse Text CSV format. You will then be presented with aExport Text Filedialogue: selectOK. You will then be presented with aWarningdialogue: selectOK.)- Close your current messy data spreadsheet (you can reopen it later).
- Open the
dates-export.csvfile (or whatever you named it). Right click and selectOpen With. Choose a plain text editor (like TextEdit or Notepad) and view the file. Notice that the dates display as month/day without any year information.- Now right click on the file again and open with Excel (or LibreOffice). In Excel, notice that the dates display with the current year, not 2015 as previously assumed by Excel. In LibreOffice, no year is added, but the date is no longer treated as a date. As you can see, exporting data from a spreadsheet program and then importing it back again can fundamentally change the data!
Note on exporting
Some versions of Excel, when exporting into a text-based format (such as CSV), will export its internal date integer representation of the date instead of the date’s value. This can potentially lead to problems if you use other software to manipulate the data as they may not understand Excel’s date encodings.
Historical data
As far as Excel is concerned, time began on 31 December 1899 and any date before this time is not real. If you are mixing historic data from before and after this date, Excel will translate only the post-1900 dates into its internal format, resulting in mixed data. If you are working with historic data, be extremely careful with your dates!
Preferred date formats
Entering a date in a single cell is quick and easy, but it is open to so many potential problems that a new solution is needed if we are to remove ambiguity from spreadsheet dates. That solution is to separate dates into their component parts. Let’s have a look at some good options for storing dates.
Storing dates as YEAR, MONTH, DAY
As previously mentioned, storing dates in YEAR, MONTH, DAY format is one good alternative for storing dates and reduces the risk of ambiguity.
For instance, the following is a spreadsheet that represents insect counts that were taken every few days over the summer:
According to Excel, this person had been collecting bugs over a number of years, including some dates in the future!
Exercise
Challenge: pulling month, day and year out of dates.
Look at the tab ‘dates’ in our messy data spreadsheet. Extract month, day and year from the dates in the “Date collected” column into three new columns called ‘month’, ‘day’, ‘year’. To do so, you can use the following built-in Excel functions:
YEAR()MONTH()DAY()- Apply the formulas on each of the row of table ‘plot 3’ in the ‘dates’ tab. To do so, drag the formula for the first row down to the last row.
- Make sure the new columns are formatted as a number and not as a date.
Solution
- Create column ‘day’ for the first row of the table (note that this is not the first row of the spreadsheet) and insert formula
=DAY(A3)in cell E3. This applies the functionDAY()on the value in cell A3, which is the date of the first observation.- Drag this formula to the last row of the table - you will see the formulas and calculations for the month appearing in the cells below.
- To format the column ‘day’ as a whole number, right click on the column ‘E’ (for ‘day’) and select
Format cells...option.Select ‘Number’ and set decimal places to 0.
Repeat the process for month and year. You should end up with a table like the one below.
Again, as in the previous exercise but this time using the
YEAR()function, we can see that Excel saved the year for data as 2015 (the year the data is entered) instead of 2014 (the year the data was collected). This was entirely the mistake of the field assistant but by being helpful Excel managed to “mask” this error.
As for dates, times are handled in a similar way and there are functions to extract hours, minutes and seconds.
(Optional) Exercise
Challenge: pulling hour, minute and second out of the current time.
Current time and date are best retrieved using the functions
NOW(), which returns the current date and time, andTODAY(), which returns the current date. The results will be formatted according to your computer’s settings.
- Extract the year, month and day from the current date and time string returned by the
NOW()function.- Calculate the current time using
NOW()-TODAY().- Extract the hour, minute and second from the current time using functions
HOUR(),MINUTE()andSECOND().Solution
- To get the year, type
=YEAR(NOW())into any cell in your spreadsheet. To get the month, type=MONTH(NOW()). To get the day, type=DAY(NOW()).- Typing
=NOW()-TODAY()will result in a decimal value that is not easily human parsable to a clock-based time. You will need to use the strategies in the third part of this challenge to convert this decimal value to readable time.- To extract the hour, type
=HOUR(NOW()-TODAY())and similarly for minute and second.
Storing dates as a single string
Another alternative is to convert the date string into a single string using the YYYYMMDDhhmmss format.
For example the date March 24, 2015 17:25:35 would become 20150324172535, where:
- YYYY: the full year, i.e. 2015
- MM: the month, i.e. 03
- DD: the day of month, i.e. 24
- hh: hour of day, i.e. 17
- mm: minutes, i.e. 25
- ss: seconds, i.e. 35
Such strings will be correctly sorted in ascending or descending order and can be correctly parsed by the receiving data analysis software. Make sure your column containing such data is formatted as ‘text’.
Key Points
Use extreme caution when working with date data.
Splitting dates into their component values can make them easier to handle.
Quality assurance and control
Overview
Teaching: 10 min
Exercises: 15 minQuestions
How can we carry out basic quality control and quality assurance in spreadsheets?
Objectives
Apply quality control techniques to identify errors in spreadsheets and limit incorrect data entry.
When you have a well-structured data table, you can use several simple techniques within your spreadsheet to ensure the data you enter is free of errors. These approaches include techniques that are implemented prior to entering data (quality assurance) and techniques that are used after entering data to check for errors (quality control). These techniques can make data entry easier as well as more robust.
Validating data on input
When we input data into a cell of a spreadsheet we are typically not constrained in the type of data we enter. In any one column, the spreadsheets software will not warn us if we start to enter a mix of text, numbers or dates in different rows. Even if we are not facing constraints from the software, as a researcher we often anticipate that all data in one column will be of a certain type (it should be). It is also possible that the nature of the data contained in the table allows us to place additional restrictions on the acceptable values for cells in a column. For example a column recording age in years should be numeric, greater than 0 and is unlikely to be greater than 120.
We will be working with a couple of examples of data validation rules but many others exist. For an overview of data validation rules available in Excel, check out the Excel support page on data validation. General steps to employ data validation are as follows.
-
Open the tab ‘semi-cleaned-combined’ of the messy data spreadsheet. It contains tables from the messy data tabs ‘2013’ and ‘2014’ combined into a single table (you may note that data is not fully yet cleaned, although it is in a much better shape than it was in the tabs ‘2013’ and ‘2014’).
-
Select the column ‘plot_id’.
-
On the
Datatab from the top level menu selectData Validation, orData Toolsand thenData ValidationorValidation Tools(depending on your version of Excel) orValidityin LibreOffice.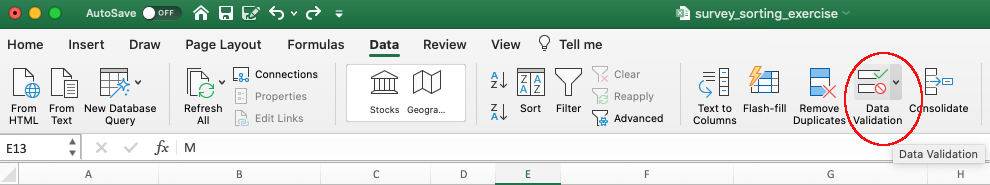
-
In the
Allowbox of tabSettingsselect ‘Whole numbers’ of data that should be in the column. Other options include decimals, lists of items, dates, and other values.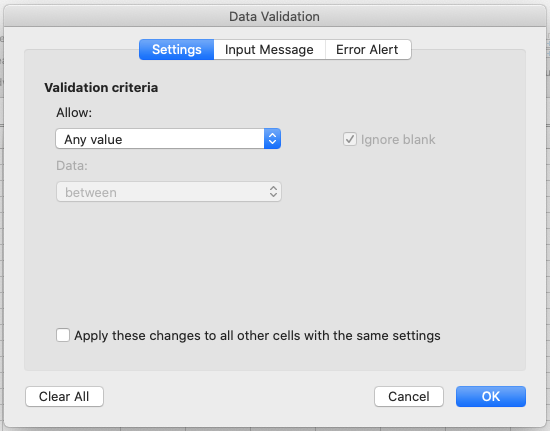
-
Now attempt to enter text into a cell in the ‘plot_id’ column. You should be prevented from doing so, as the column is now locked down to whole numbers only.
Excel allows us to specify a variety of data validations to be applied to cell contents.
If the validation fails, an error is raised and the data we attempted to enter is rejected.
In addition to providing validation when we enter data, Excel allows us to add validations to data that has
already been entered. Note, however, that the validation is not applied retrospectively, so that incorrect data are not removed.
Instead, if a particular cell with a value entered previously fails the validation check - depending on the Excel version -
a triangle may be placed in the top left corner of
the cell as a warning, or you may not get any warning at all (but you may be able to request invalid cells to be
circled from the Data validation drop-down button).
For this reason, it is best practice to set up validations before you start entering data.
Restricting data to a numeric range
Now let’s try this out by setting the ‘plot_id’ in our spreadsheet to only allow plot values that are integers between 1 and 24.
Exercise
Set the ‘plot_id’ column in tab ‘semi-cleaned-combined’ of the messy data spreadsheet to only allow values that are integers between 1 and 24.
Solution
- Open the tab ‘semi-cleaned-combined’ of messy data spreadsheet and select the ‘plot_id’ column.
- On the
Datatab the top level menu selectData Validation, orData Toolsand thenData ValidationorValidation Tools(depending on your version of Excel) orValidityin LibreOffice.- In the
Allowbox of theSettingstab selectWhole number(and in LibreOffice select theDatafield to bevalid range.- Set the minimum and maximum values to 1 and 24.
Now let’s try entering a new value in the plot column that is not a valid plot id. The spreadsheet stops us from entering the wrong value and asks us if we would like to try again.
You can also customise the resulting message to be more informative by entering your own message in the
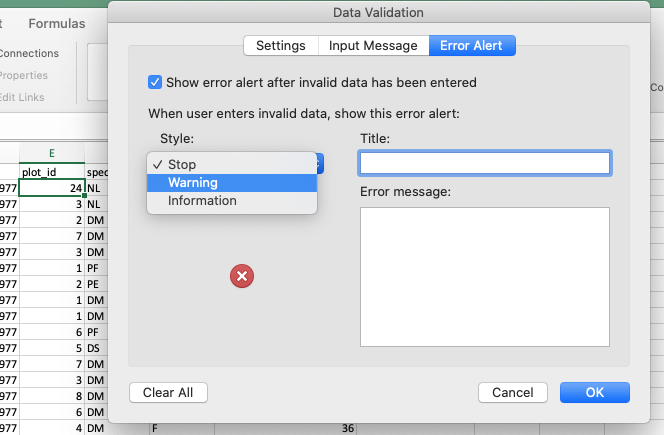
Input Messagetab (or, in LibreOffice, by selecting theError alerttab and entering a message in theError messagefield).You can also set the invalid data to result in a warning rather than an error by modifying the
Styleoption on theError Alerttab (or theActionfield in LibreOffice).- In newer versions of Excel, you may also have an option to indicate all previous invalid entries once you have entered your restricted values.
You have now provided a restriction that will be validated each time you try and enter data into the selected cells. If you type a value which is not on the list you will get an error message. This not only prevents data input errors, but also makes it easier and faster to enter data.
Restricting data to entries from a list
If you use a list of options to restrict data entry, the spreadsheet will provide you with a drop-down list of the available items. Think about trying to remember how to spell “Dipodomys spectabilis” for species each time you need to enter that value, or whether or not you capitalised the words correctly. By restricting values in cells to a predefined list of values, you can select the right option from the list every time. Let’s apply this to our data.
Exercise
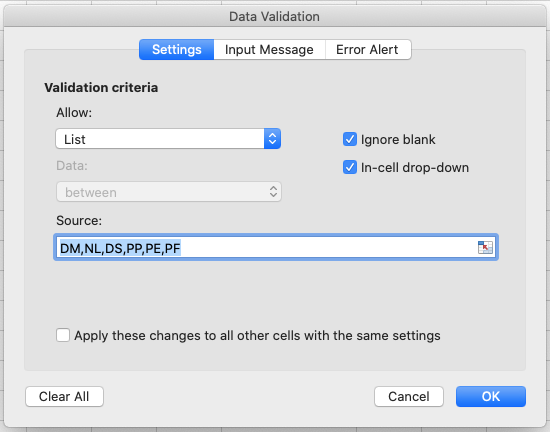
Restrict the values of the ‘species_id’ column in tab ‘semi-cleaned-combined’ of the messy data spreadsheet to allow only values from the following list: “DM, NL, DS, PP, PE, PF”.
Solution
- Open the tab ‘semi-cleaned-combined’ of
messy_survey_data.xlsand select the ‘species_id’ column.- On the
Datatab the top level menu selectData Validation, orData Toolsand thenData ValidationorValidation Tools(depending on your version of Excel) orValidityin LibreOffice.- In the
Allowbox of theSettingstab selectList.- Type a list of all the values that you want to be accepted in this column, separated by a comma (with no spaces). For example, type “DM,NL,DS,PP,PE,PF” (in LibreOffice, skip the commas and add each entry to a new line). Note this is only a small subset of allowed species ids - the whole set is much larger but for the purposes of this exercise we want to show you how to restrict a cell to a list of values and what happens when old data does not conform to this restriction.
- Create a meaningful input message and modify alert error type, as in the previous exercise, then click OK.
- Scroll to the bottom of your data and select a cell in the
species_idcolumn in a new row. When a cell in this column is selected, a drop-down arrow will appear. When you click the arrow you will be able to select a value from your list of allowed values.- In newer versions of Excel, you may also have an option to indicate all previous invalid entries once you have entered your restricted values.
You have now provided a restriction that will be validated each time you try and enter data into the selected cells. If you type a value which is not on the list you will get an error message. This not only prevents data input errors, but also makes it easier and faster to enter data.
Typing a list of values where only a few possible values exist might be convenient, but if the list is longer (e.g.
all allowed species) it
makes sense to create it as a small table (in a separate tab of the workbook).
We can give the table a name and then reference the table name as the source of acceptable inputs when the source box
appears in the Data Validation pop-out. For example, the table of all species can be copied from the
file species.csv and then referenced
in your spreadsheet to provide the list of all valid species names and their abbreviations (ids).
Using a table in this way makes the data entry process more flexible.
If you add or remove contents from the table, then these are immediately reflected in any new cell entries based on this source.
You can also have different cells refer to the same table of acceptable inputs.
Quality control - identifying outliers
Tip: keep your raw data - raw
Before doing any quality control operations, save your original file with the formulas and a name indicating it is the original data. Create a separate file with a new name, and ensure your data is stored as values and not as formulas. Because formulas refer to other cells, and you may be moving cells around, you may compromise the integrity of your data if you do not take this step!
Tip: keep track of your modifications
As you start manipulating your data files, create a
README.txttext file to keep track of your files and document your manipulations so that they may be easily understood and replicated, either by your future self or by an independent researcher. YourREADME.txtfile should document all of the files in your data set (including documentation), describe their content and format, and lay out the organising principles of folders and subfolders. For each of the separate files listed, it is a good idea to document the manipulations or analyses that were carried out on those data. Cornell University’s Research Data Management Service Group provides detailed guidelines for how to write a good README file, along with an adaptable template.
Sorting data
Bad values often sort to the bottom or top of the column. For example, if your data should be numeric, then alphabetical and null data will group at the ends of the sorted data. Sort your data by each field, one at a time. Scan through each column, but pay the most attention to the top and the bottom of a column. If your dataset is well-structured and does not contain formulas, sorting should never affect the integrity of your dataset.
Tip: expand the sort
Remember to expand your sort in order to prevent data corruption. Expanding your sort ensures that the all the data in one row move together instead of only sorting a single column in isolation. Sorting by only a single column will scramble your data - a single row will no longer represent an individual observation.
Exercise
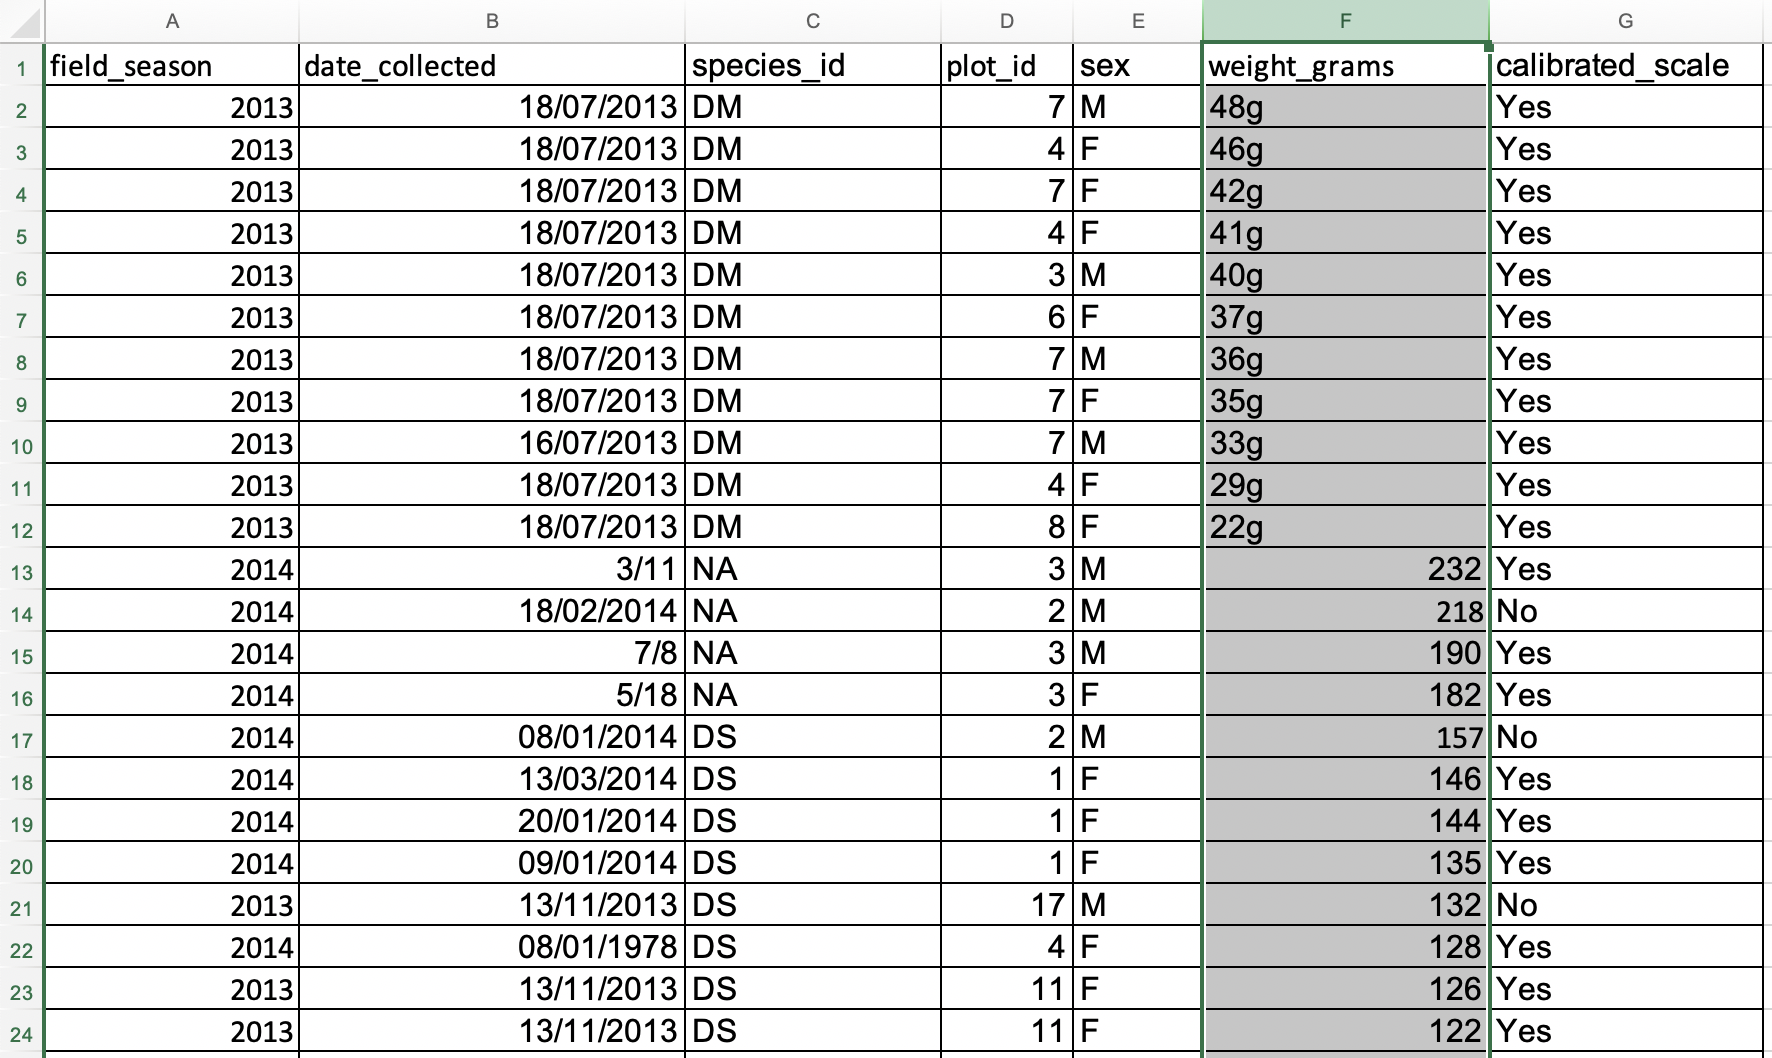
Look at the ‘semi-cleaned-combined’ tab of the messy data spreadsheet. It contains tables from the messy data tabs ‘2013’ and ‘2014’ combined into a single table in a single tab (you will note that the data is not yet fully cleaned).
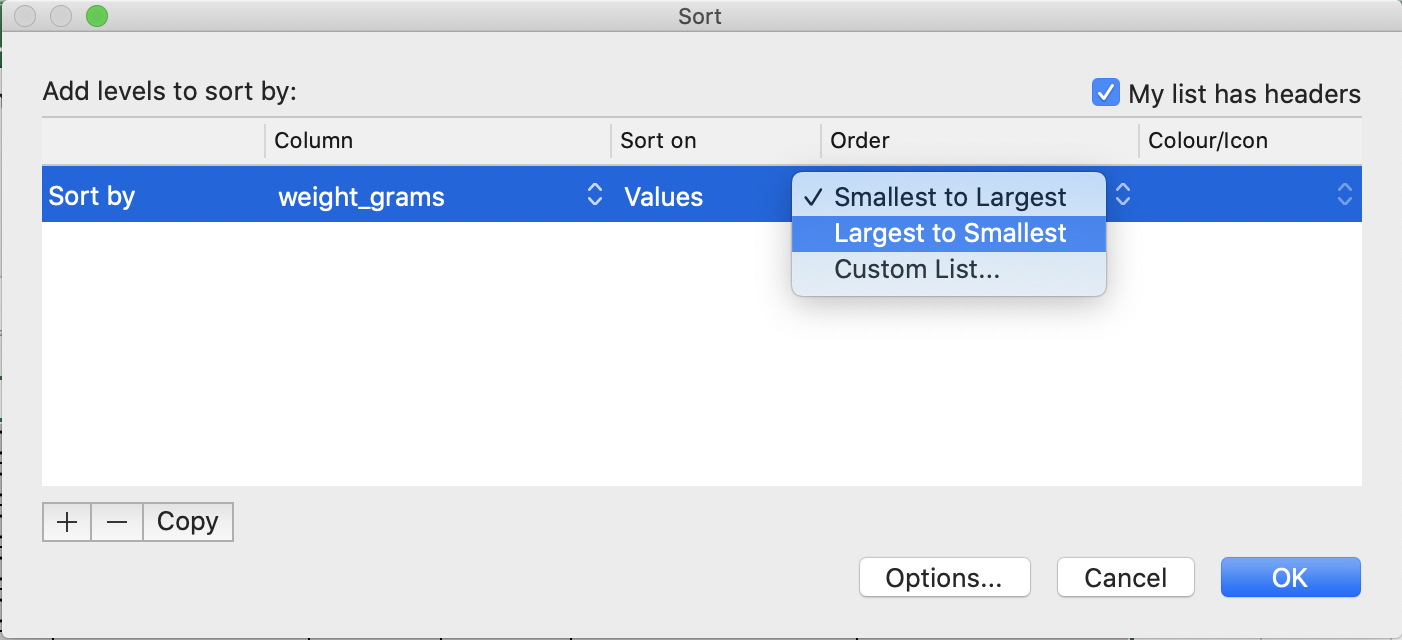
Sort the
weight_gramscolumn in your spreadsheet program fromLargest to Smallest. What do you notice?Solution
- Select
weight_gramscolumn.- Click the
Sortbutton on the Data tab from the top level menu in Excel (in LibreOffice select theDatamenu and then selectSort.Note that in older versions of Excel you may get just the
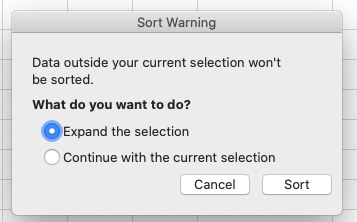
Sortbutton without the drop-down menu, followed by a pop up window to specify the column you want to sort and the sort order (shown in figure below).- In the pop-up that appears make sure you select
Expand the selectionto make sure data in other columns is moved together with the data in the column you are sorting.- Note how the odd values sort to the top and bottom of the data. The cells containing no data values sort to the bottom of the tabular data, while the cells where the letter “g” was included can be found towards the top or bottom. This is a powerful way to check your data for outliers and odd values.
Conditional formatting
Conditional formatting allows you to format data based on some criteria, e.g. you can colour code your values by some criteria from lowest to highest. This can also make it easier to scan your data for outliers. Conditional formatting should be used with caution, but it can be a great way to flag inconsistent values or errors when entering data. Let’s apply some to our data.
Exercise
Look at the ‘semi-cleaned-combined’ tab of the messy data spreadsheet and apply any
2-Color Scaleformatting rule to columnweight_grams.Solution
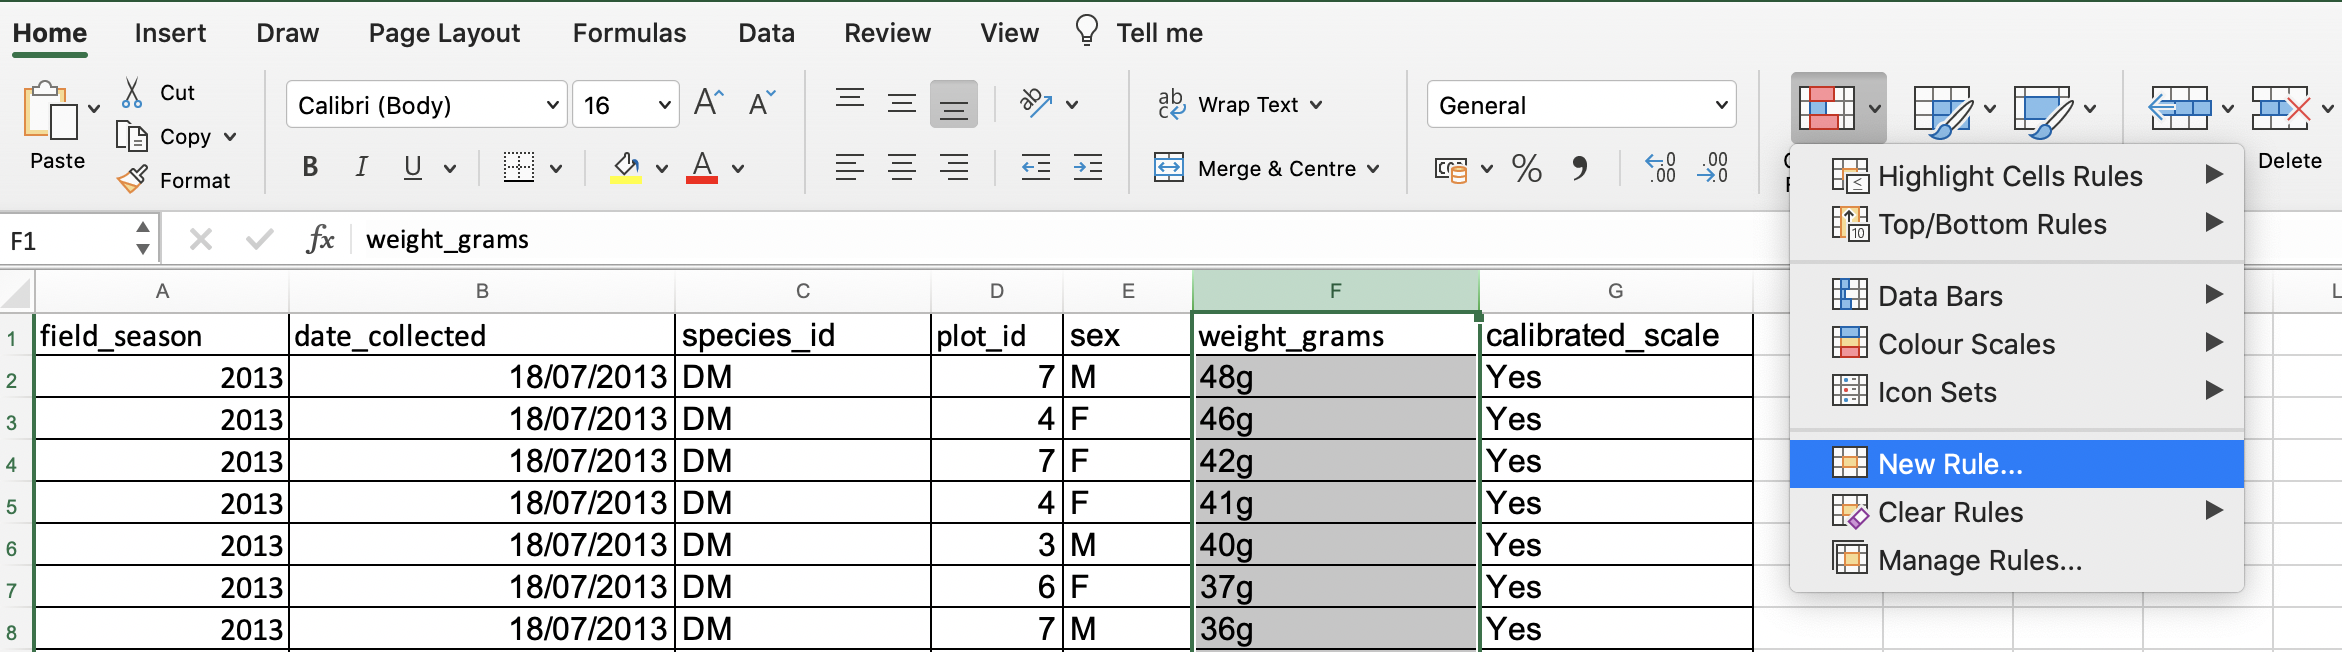
- Select
weight_gramscolumn.- In the main Excel menu bar, click
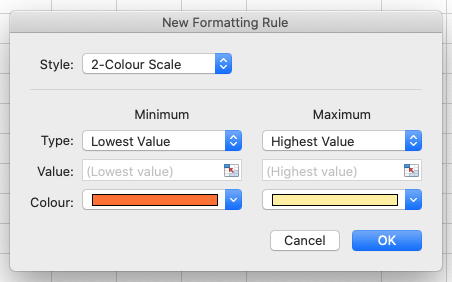
Home>Conditional Formatting...chooseNew rule(in LibreOffice from theFormatmenu, selectConditionaland thenColor scale).- In the
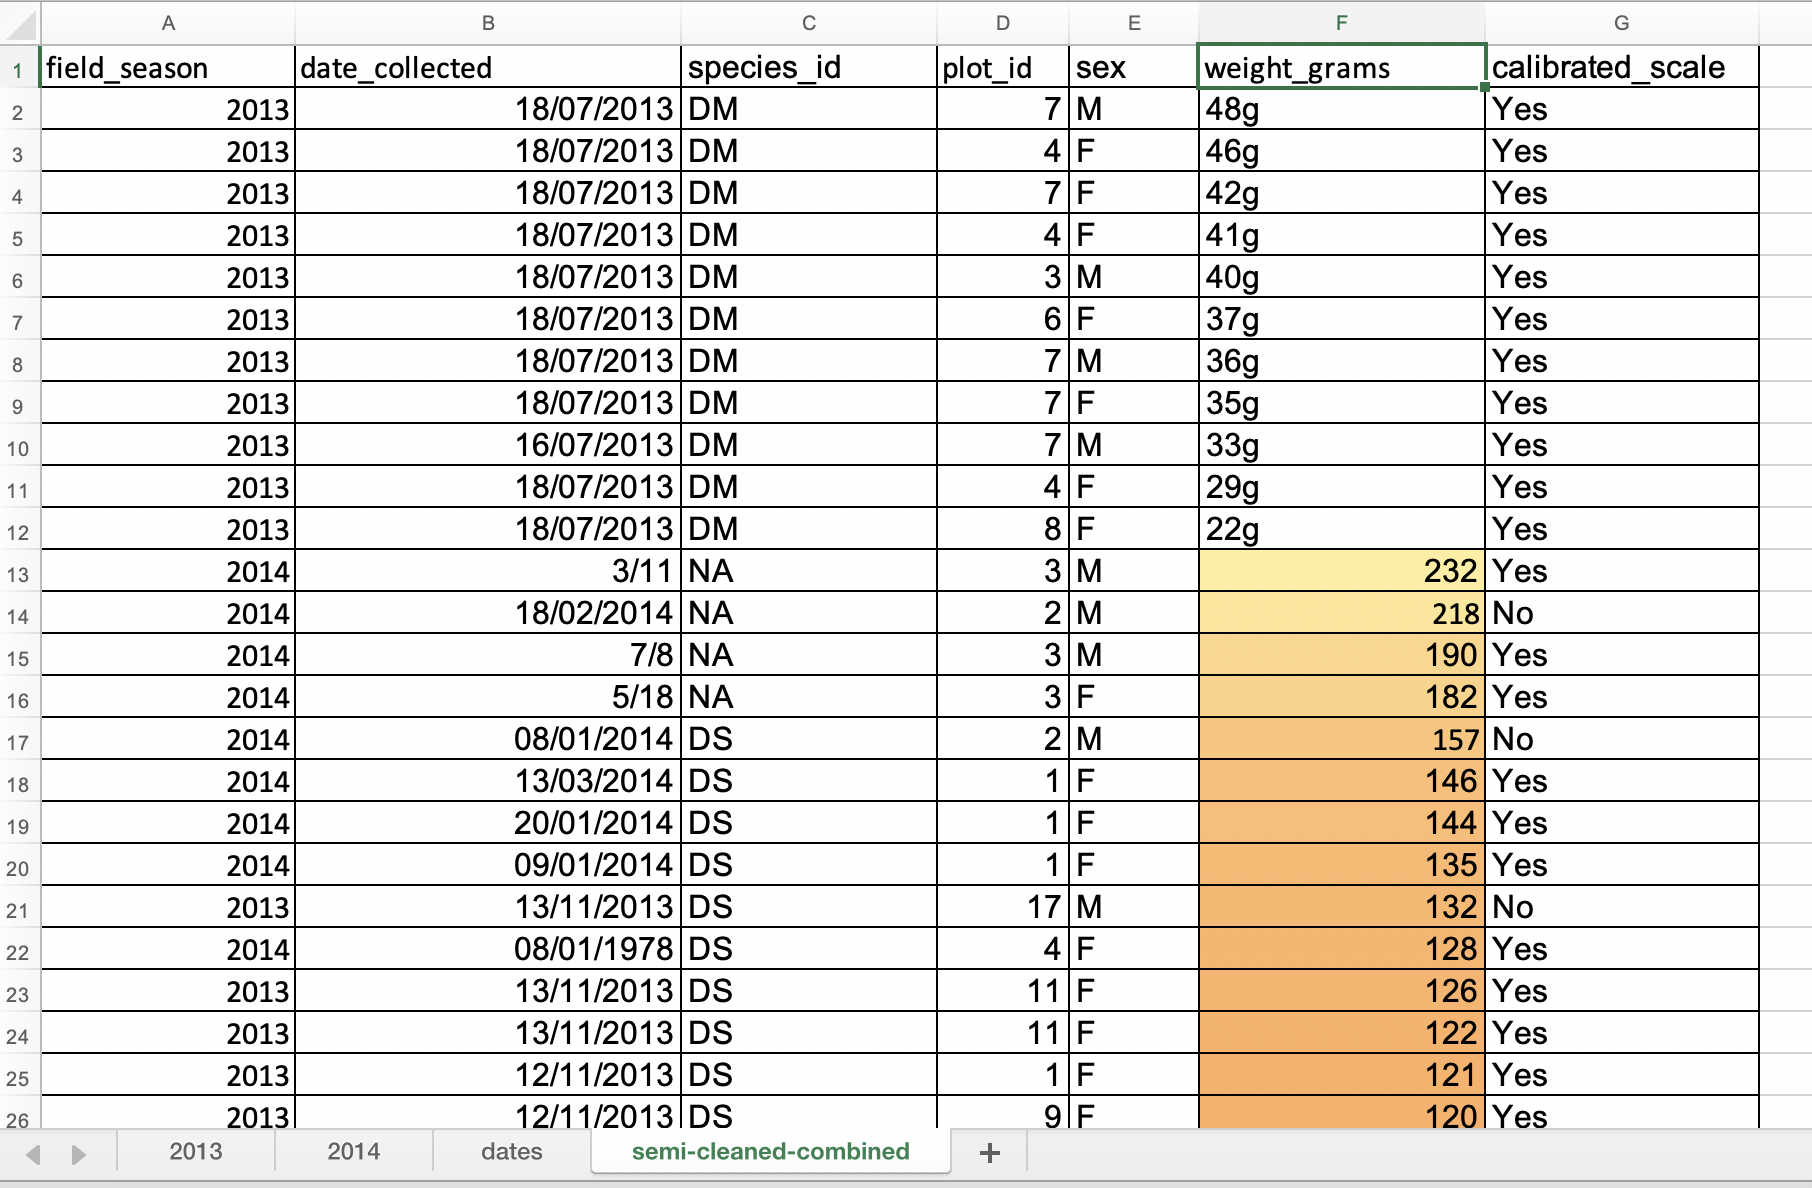
New Formatting Rulewindow, apply any2-Color Scaleformatting rule. (In LibreOffice selectColor scale (2 entries)from the top-middle drop-down list and clickOK.- Now we can scan through the column and different colours will stand out. Do you notice any strange values?
- Cells that contain non-numerical values are not coloured making them easier to spot. This includes both the cells where the letter “g” was included and the empty cells. They show up at either at the top or at the bottom of the data but may not be as easy to spot if you have a very large dataset and have to scroll a lot.
Scanning for outliers
It is nice to be able to do these scans for outliers in spreadsheets (such as using sorting or conditional formatting), but we can also do these checks in a programming languages like R, Python and SQL, or using OpenRefine - which may be even more suitable if you have larger datasets with, e.g., with 10K+ or 100K+ rows which are difficult to scroll down to the bottom of to spot outliers.
Key Points
Always copy your original spreadsheet file and work with a copy so you do not affect the raw data.
Use data validation to prevent accidentally entering invalid data.
Use sorting to check for invalid data.
Use conditional formatting (cautiously) to check for invalid data.
Exporting data
Overview
Teaching: 10 min
Exercises: 0 minQuestions
How can we export data from spreadsheets in a way that is useful for downstream applications?
Objectives
Store spreadsheet data in universal file formats.
Export data from a spreadsheet to a CSV file.
Storing the data you are going to work with for your analyses in Excel
default file format (*.xls or *.xlsx - depending on the Excel
version) is not a good idea. Here are some reasons why:
- Excel’s
*.xlsor*.xlsxare proprietary file formats, and it is possible that in the future technology will not exist (or will become sufficiently rare) to make it inconvenient, if not impossible, to open the file. For example,*.xlsis already an older file format than*.xlxsand it is possible that Microsoft may retire it in the future. - Other spreadsheet software may not be able to open files saved in a proprietary Excel format.
- Different versions of Excel may handle data differently, leading to inconsistencies.
- Journals and grant agencies are increasingly requiring you to deposit your data in a data repository, and most of them do not accept Excel format (because of the reasons listed above). Instead, these data repositories require files to be deposited in one of the formats discussed below.
The above points also apply to other formats such as open data formats used by LibreOffice and Open Office. These formats are not static and do not get parsed the same way by different software packages.
As an example of inconsistencies in data storage, remember how we investigated how Excel stores dates. There are multiple defaults for different versions of the software, and you can switch between them all. So, say you are compiling Excel-stored data from multiple sources. There are dates in each file - Excel interprets them as their own internally consistent numbers. When you combine the data, Excel will take the serial number from the place you are importing it, and interpret it using the rule set for the version of Excel you are using. These rules may not align. Essentially, you could be adding errors to your data, and it would not necessarily be flagged by any data cleaning methods.
Storing data in a universal, open, and static format will help deal with this problem, e.g. formats such as tab-delimited (tab separated values or TSV) or comma-delimited (comma separated values or CSV). CSV files are plain text files where the columns are separated by commas, hence ‘comma separated values’ or CSV. The advantage of a CSV file over an Excel or other proprietary formats is that we can open and read a CSV file using just about any software, including plain text editors like TextEdit or NotePad. Hence these files are more robust and more likely to be accessible in the future.
Data in a CSV file can also be easily imported into other formats and environments, such as SQLite and R. We are not tied to a specific version of a specific (potentially expensive) program when we work with CSV files, so it is a good format to work with for maximum portability and endurance. Most spreadsheet programs can save to delimited text formats, although they may give you a warning during the file export.
To save a file you have opened in Excel in CSV format:
- From the top menu select
FilethenSave as. - You will be presented with different options for exporting to CSV file format, depending on your Excel version.
- In the ‘Format’ field, from the list select
CSV UTF-8 (Comma-delimited)(*.csv)(orText CSV (.csv)in LibreOffice).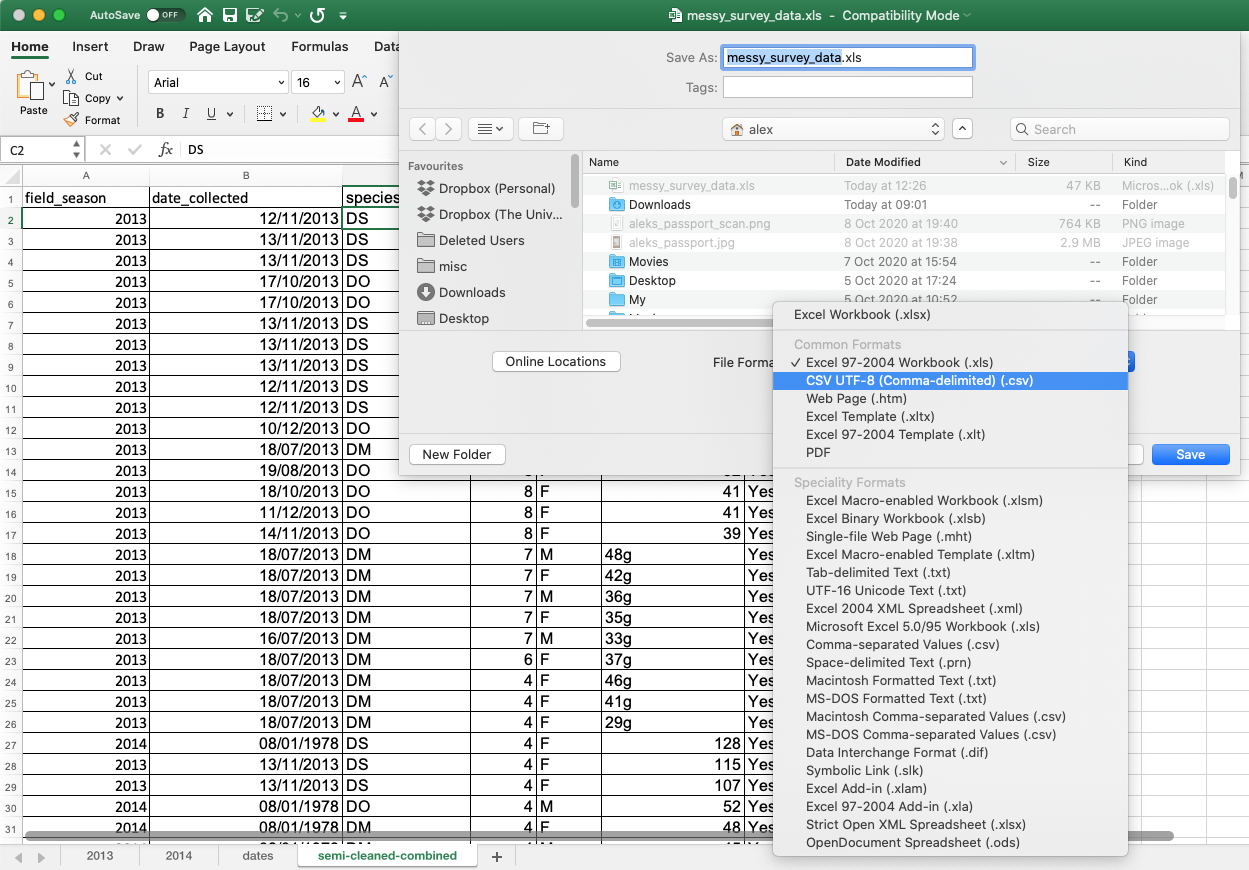
- Double check the file name and the location where you want to save it and hit ‘Save’.
-
If you are saving an Excel file with multiple tabs, Excel will save only the currently active sheet (there is no option for multiple tabs in CSV) and warn you that you cannot save multiple sheets to a CSV file at the same time. If you need to save multiple tabs, you must save each one as its own CSV file.
Note on backwards compatibility
You can open CSV files in Excel (or LibreOffice)!
A note on Python/R and Excel’s
.xls/.xlxsformatsThere are Python and R packages that can read
.xls/.xlxsfiles. It is even possible to access different worksheets in the Excel spreadsheet documents. However, because these packages parse data tables from proprietary and non-static software, there is no guarantee that they will continue to work on new versions of Excel. Exporting your data to CSV or TSV format is much safer and more reproducible.
Note: when data contains commas
In some datasets, the data values themselves may include commas (,). In that case, you need to make sure that the commas are properly escaped when saving the file. Otherwise, the software that you use (including Excel) will most likely incorrectly display the data in columns. This is because the commas which are a part of the data values will be interpreted as delimiters.
If you are working with data that contains commas, the fields should be enclosed with double quotes. This should occur automatically when you export from a spreadsheet program. However, it is always a good idea to double check your CSV after it is saved by opening it in a spreadsheet program and reviewing the columns to ensure that no new ones have been added. For more of a discussion on data formats and potential issues with commas within datasets see the discussion page.
Key Points
Data stored in common spreadsheet formats will often not be read correctly into data analysis software, introducing errors into your data.
Exporting data from spreadsheets to formats like CSV or TSV puts it in a format that can be used consistently by most programs.