Common spreadsheet errors
Overview
Teaching: 10 min
Exercises: 15 minQuestions
What are some common challenges with formatting data in spreadsheets and how can we avoid them?
Objectives
Recognise and resolve common spreadsheet formatting problems.
There are a few potential errors to be on the lookout for in spreadsheet data. If you are aware of the errors, and the complications they can cause on downstream data analysis and result interpretation, it helps motivate you and your project members to try and avoid them. It’s far more efficient to prevent problems by making small changes in the way you collect data, than spending weeks or months cleaning messy data. Ultimately, good organisation of your data in improves your research efficiency and reliability. Here are some common spreadsheet errors, which we will cover in detail below:
- Using multiple tables
- Using multiple tabs
- Not filling in zeros
- Using problematic null values
- Using formatting to convey information
- Using formatting to make the data sheet look pretty
- Placing comments or units in cells
- Entering more than one piece of information in a cell
- Using problematic field names
- Using special characters in data
- Inclusion of metadata within data
- Date formatting
Using multiple tables
A common mistake is creating multiple data tables within a single spreadsheet, as shown below. This will confuse a data analysis program (and many humans too).
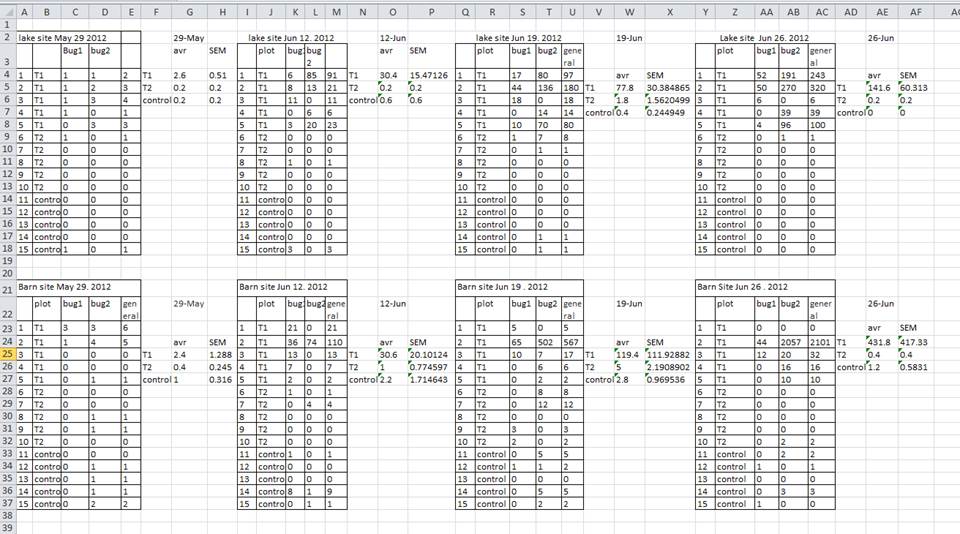
There are a number of problems with multiple tables on one page. The main problem is that - although clearly separate to a human observer - a computer will rigidly interpret anything in the same row as belonging to the same observation.
In the example above, the computer will read row 4 and assume that all columns A-AF refer to the same sample. This row actually represents four distinct samples (sample 1 for each of four different collection dates - May 29th, June 12th, June 19th, and June 26th), as well as some calculated summary statistics (an average (avr) and standard error of measurement (SEM)) for two of those samples.
There is no reason why observations from different sites or different years should not go into a single table. You just need to keep track of them by using new columns (in this examples, one for site and one for year). Keeping data from the same experiment in a single table will help you stick to a consistent data structure, and avoid errors when looking up data from different tables.
Using multiple tables on one page also makes it difficult for humans to keep track of the data - especially if one of the tables is hidden off the edge of the spreadsheet. Multiple tables also increases the risk of using the same column name in multiple places, which will make it significantly harder to clean your data.
Using multiple tabs
But what about workbook tabs? Are they the easy solution to organising data? In a word, no!
-
When you create extra tabs, you prevent the computer from seeing connections that exist in the data. Before you can analyse the data, you need to explicitly tell the computer how to combine the data across tabs. If the tabs are inconsistently formatted, you might even have to do this manually, which is inefficient. We used multiple tabs in our example messy data file, and you have now seen how difficult it is to consolidate the data across tabs.
-
Separating your data over multiple tabs means that you are more likely to accidentally add inconsistencies to your data, because it is all too easy to forget to change to the appropriate tab before recording new data. Similarly, when it comes to analysis, it’s easy to draw data from the wrong tab.
Rather than entering data into multiple tabs, try adding another column to your spreadsheet.
Note on bigger data and column headers
Your datasheet might get very long over the course of the experiment. This makes it harder to enter data if you cannot see your headers at the top of the spreadsheet. But do not be tempted to repeat your header row in the middle of your data - these headers will get mixed into the data leading to problems down the road. Instead, you can freeze the column headers so that they remain visible even when you have a spreadsheet with many rows. if you are not sure how to do this, see the documentation on how to freeze column headers in Excel.
Not filling in zeros
Sometimes the thing you are measuring throws out the odd zero - sometimes the observations are almost all zeros. Is it really necessary to keep typing in zeros? Wouldn’t it be more efficient to leave the column blank unless there’s a non-zero?
To a computer, there is a big difference between a zero and a blank cell. A zero is data. A blank cell means that there was no measurement, and the computer will interpret it as an unknown value (otherwise known as a null value).
Spreadsheets are likely to misinterpret blank cells that you intend to be zeros, and statistical analysis programs are very likely to interpret blank cells. By not entering the value of your observation, you are telling your computer to represent that data as unknown or missing (null). This can cause problems with later analysis. To take a simple example: the average of a set of numbers which includes a single null value is always null (because the computer cannot guess the value of the missing observations).
It is very important to record zeros as zeros and truly missing data as nulls.
Using problematic null values
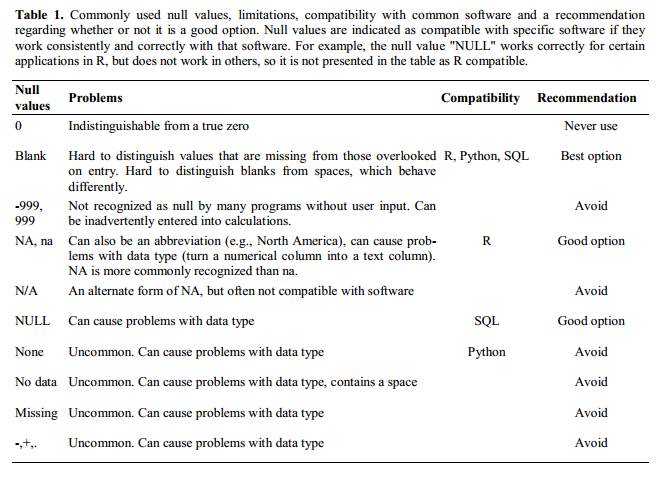
Null values are also problematic! Different people take different approaches to recording the lack of data (see below), but not all approaches are useful.
Sometimes different null values are used to describe the different reasons why the observation could not be made. “NULL”, “missing data” and “malfunction”, all convey important information, but you are in effect using a single column to capture three different types of information. This is messy, as described on the previous page, and the solution is to include new columns - one for each type of information you need to capture.
Sometimes unacceptable null values are automatically recorded by the device you use to measure the observation (older devices are especially guilty of not following best practice). If the erroneous null values stem from the measuring device, you’re left with little choice but to clean the data and replace them with a better null value. A tool like OpenRefine, which will be introduced in a later lesson, is perfect for this kind of cleaning.
Whatever the reason, it is a problem if unknown or missing data is recorded as -999, 999, or 0. Statistical programs do not know that these are intended to represent missing (null) values and, because they are valid numbers, they will be included in calculations which will lead to incorrect results. How these values are interpreted will depend on the software you use to analyse your data.
It is essential to use a clearly defined and consistent null indicator. Although open to ambiguity, blanks are still used by a number of applications, but options like and ‘NA’ (for R) and ‘NaN’ (for Python) are good choices. For more information, see White et al. Nine simple ways to make it easier to (re)use your data.
Using formatting to convey information
A common examples of using formatting to convey information is to highlight cells in a sepcific colour that you want dealt with differently to others. For example, highlighting cells that should be excluded from the analysis (see below). Another example is to leave a blank row to indicate a separation in the data. Both of these highlighting approaches will cause problems with later analysis because they are undetectable to computers.
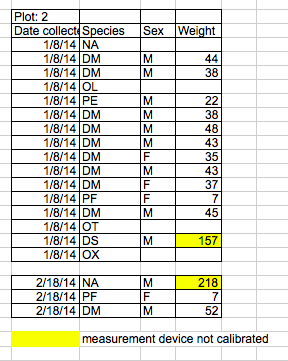
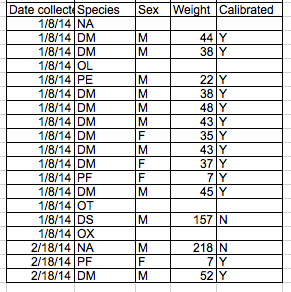
The solution - as is so often the case with spreadsheets - is to create a new column to encode the data that should be excluded.
Using formatting to make the spreadsheet look pretty
It’s very difficult not to tweak your tables to make them look prettier, e.g. merging cells (especially in headers) or using borders to separate different data. If you are not careful, formatting a worksheet to be more aesthetically pleasing can compromise your computer’s ability to see associations in the data. For example, merged cells will confuse statistics software, which will read the merged cell as a single data value and cause misalignment with data in the following rows.
Your primary goal with structuring data is to accurately capture the data and make the connections in the data transparent to yourself and any program you use for analysis. You will want pretty tables for publications and suchlike, but those should be completely separate from the tables you use to record the data.
Placing comments or units in cells
Sometimes you need to make a note or a comment on an observation. For example, you may want to identify observations that were collected by a summer student who you later found out was misidentifying some of your species. These data you will want to identify as suspect.
The problem is the same as that with formatting data to convey information: most analysis software cannot see Excel or LibreOffice comments, so they would be ignored. The solution is the same as described for formatting, create another column if you need to add notes to cells.
Do not include units in cells! They cause a headache in later analysis when you have to separate out the unit from its associated value. Ideally, all the measurements you place in one column should be in the same unit, but if for some reason they are not, create a new column to specify the units.
Entering more than one piece of information in a cell
As described on the previous page, the rule is “one cell, one observation”. For example, if you are counting species and you find one male and one female of the same species, you could enter this as ‘1M, 1F.’ By this stage in the lesson, you will probably find yourself instinctually repelled by this practice! If you record two pieces of data in the same cell, you will confuse data analysis software and this risks mistakes in analysis.
The solution is to include one column for the number of individuals and a separate column for the sex.
Using problematic field names
The key here is to choose descriptive column names to allow for easy data identification.
There is a delicate balance in choosing the correct length of column name. Longer names allow you to adequately describe the data, but they can become unwieldy. It is better to err on the side of a longer, descriptive column name, than a shorter, ambiguous one. You can use abbreviations to reduce the length of column names, but these can quickly become obscure (especially if you don’t return to the data for 6 months or longer). If you use unconventional abbreviations, make sure to keep a record of their full description in the text file you keep with the spreadsheet data.
You must be careful with the characters you use. Do not use spaces, numbers, or special characters of any kind. All of these can cause problems when conducting later analysis. Spaces can be misinterpreted as delimiters (i.e. they can be used by some programs to show where a column begins and ends), some programs do not like field names that are text strings that start with numbers, and some characters (e.g. “/”) can be misinterpreted by data analysis programs.
Instead of spaces, the best advice is to use underscores (_) to separate words. Some people use CamelCase (where
uppercase letters are used to delimit words, e.g. ExampleFileName) but they are more difficult to read and, if you ever
want to return the whitespaces later in your analysis, it is easier to do this with underscore-separated words than
CamelCase.
Where all the observations share the same unit, it can be useful to include the unit in the field name to avoid later confusion. Alternatively, as described above, include the unit in a separate column.
The table below gives some examples of best practice in naming:
| Good Name | Good Alternative | Avoid | Reason to avoid |
| Max_temp_C | MaxTempC | Maximum Temp (°C) | Uses a special character (°) |
| Precipitation_mm | Precipitation | precmm | Not very readable |
| Mean_year_growth | MeanYearGrowth | Mean growth/year | Uses a special character (/) |
| sex | sex | M/F | Uses special character (/) and not very readable |
| weight | weight | w. | Uses a special character (.) and not very readable |
| cell_type | CellType | Cell Type | Uses a blank character |
| Observation_01 | first_observation | 1st Obs | Uses a blank character and starts with a number |
Using special characters in data
Do not use your spreadsheet as a word processor! If you copy text directly from a Microsoft Word (or similar applications), you are likely to include lots of formatting information (e.g. tabs, line breaks, etc.) and fancy non-standard characters (left- and right-aligned quotation marks, em-dashes, etc.) that will confuse data analysis software.
Best practice is to avoid adding anything other than text and spaces into a cell.
Inclusion of metadata within data
We have already learned that metadata is the data you record about your data - how the data was collected and organised. This is just to reiterate that metadata should not be contained within the data itself. So, you should explain comments, units, information about how null values are encoded and all other information relevant to your data in a separate file in the same folder as your data or a separate tab within your data spreadsheet.
Fixing mistakes in data organisation
Let’s put this theory into practice! If you have not already done so, download the messy survey data (as outlined in Setup section). We will now clean this data and learn some best practices in the process.
Take the messy version of the survey data and open it in a spreadsheet program. There are four tabs:
- Two field assistants conducted the surveys, one in 2013 and one in 2014, and they both kept track of the data in their own way in the tabs ‘2013’ and ‘2014’, respectively.
- Ignore the ‘dates’ tab for now, we will come back to it later in the lesson.
- The ‘semi-cleaned-combined’ tab contains combined data from tabs ‘2013’ and ‘2014’. Reproducing this tab is what the exercise is all about. However, we will revisit this tab in episode on quality assurance and control and you will see why it is ‘semi-clean’.
Exercise
The goal of this exercise is to create a cleaned data set in a new tab by combining the data from tabs ‘2013’ and ‘2014’. You will need to identify what is wrong with the way the data is arranged in these two tabs, and then make steps to clean the data before combining it.
Whilst completing this exercise, you might like to contemplate how much time could be have been saved if the researchers had agreed on a data format before the collection took place, and how long it would take to clean real-world research data that could contain many millions of records.
Keep your raw data - raw
Do not forget to create a new file or a new tab for the cleaned data; never modify your original (raw) data.
Solution
When you finish, compare your clean spreadsheet with the structure suggested below or with surveys.csv which is the example cleaned data file you downloaded during setup. For example, you could chose to record your data using the following columns:
- date_collected
- plot_id species_id
- sex
- hindfoot_length_cm
- weight_grams
- scale_calibrated
- comments
Your cleaned spreadsheet might not be identical to either of the above, but it should have a similar overall structure. We will address the reasoning behind separating date components in 3 separate columns in surveys.csv in the next episode on formatting dates in spreadsheets.
Full & clean dataset
If you want to have a look at the full, clean dataset - have a look atsome of the other files you downloaded. surveys.csv combines data from all the surveys and combined.csv includes the cleaned data from surveys.csv, plots.csv and species.csv combined into one clean file.
Key Points
Avoid using multiple tables within one spreadsheet.
Avoid spreading data across multiple tabs.
Record zeros as zeros.
Use an appropriate null value to record missing data.
Do not use formatting to convey information or to make your spreadsheet look pretty.
Place comments in a separate column.
Record units in column headers.
Include only one piece of information in a cell.
Avoid spaces, numbers and special characters in column headers.
Avoid special characters in your data.