Filtering and Sorting Data
Overview
Teaching: 20 min
Exercises: 10 minQuestions
How can we select only a subset of our data to work with?
How can we sort our data?
Objectives
Employ text filters or sub-setting options in facets to filter to a subset of rows.
Sort data by one or multiple columns.
Filtering data
Sometimes you want to view and work only with a subset of data or apply an operation only to a subset. You can do this by applying various filters to your data.
Including/excluding data entries on facets
One way to filter down our data is to use the include or exclude buttons on the entries in a text facet.
If you still
have your text facet for scientificName, you can use it. If you’ve closed that facet, recreate it by selecting Facet >
Text facet on the scientificName column.
- In the text facet, hover over one of the names, e.g.
Baiomys taylori. Notice that when you hover over it, there are buttons to the right foreditandinclude. - Whilst hovering over
Baiomys taylori, move to the right and click theincludeoption. This will include this species, as signified by the name of the species changing from blue to orange, and new options ofeditandexcludewill be presented. Note that in the top of the page, “46 matching rows” is now displayed instead of “35549 rows”. - You can include other species in your current filter - e.g. click on
Chaetodipus baileyiin the same way to include it in the filter. - Alternatively, you can click the name of the species to include it in the filter instead of clicking the
include/excludebuttons. This will include the selected species and exclude all others options in a single step, which can be useful. - Click
includeandexcludeon the other species and notice how the entries appear and disappear from the data table to the right.
You can also filter data using other types of facets - let’s do it as an exercise.
Exercise
Remove all current facets and recreate the scatterplot facet for
recordIDandperiodcolumns as before. Drag a rectangular selection anywhere on theScatterplot Matrixsquare forrecordIDandperiod. Notice how the filtered data change to show only entries included in the rectangle.Solution
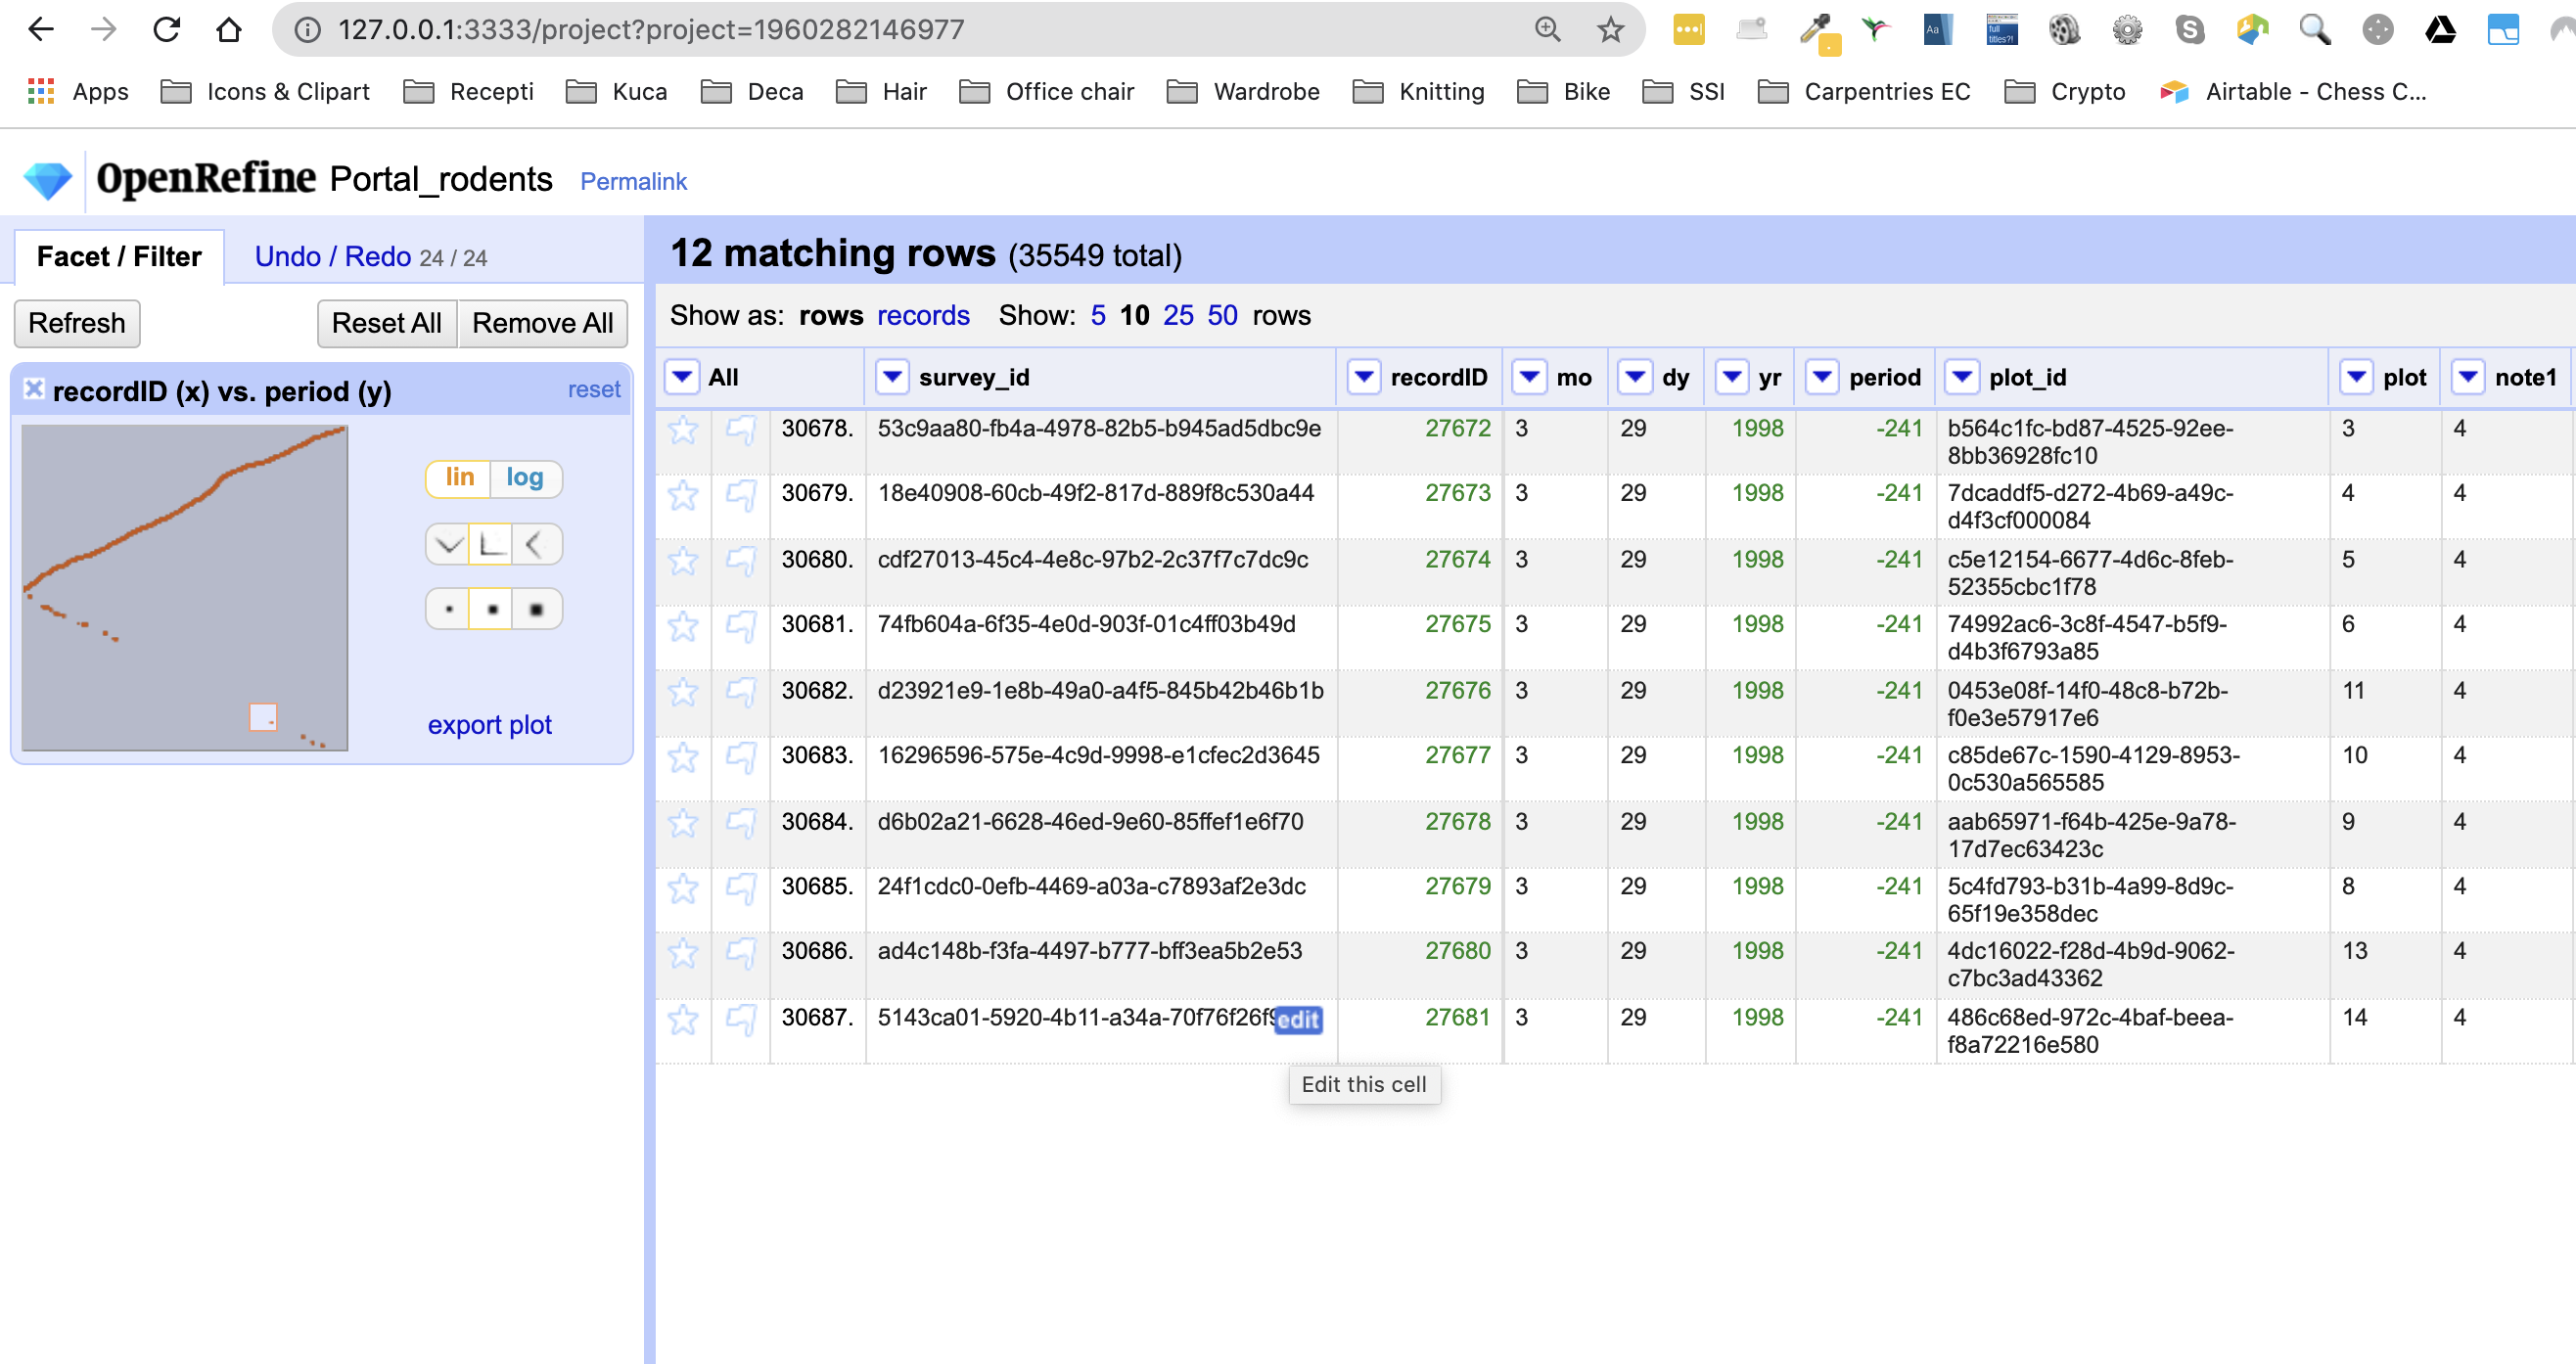
In the screenshot below, we have filtered out only 12 entries by dragging a small rectangular selection on the scatterplot graph. As before, when we first introduced the scatterplot facet, we can notice that something is potentially wrong with our data as values for
periodin the filtered subset are negative (we are expecting only positive values) and potentially require futher examination and cleaning.
Text filters
Another way to filter data is to create a text filter on a column. Close all facets you may have created previously
and reinstate the text facet on the scientificName column.
- Click the down arrow next to
scientificName>Text filter. AscientificNamefilter will appear on the left margin below the text facet. -
Type in
baiinto the text box in the filter and press return. At the top of the page it will report that, out of the 35549 rows in the raw data, there are 48 rows in which the text has been found within thescientificNamecolumn (and these rows will be selected for the subsequent steps).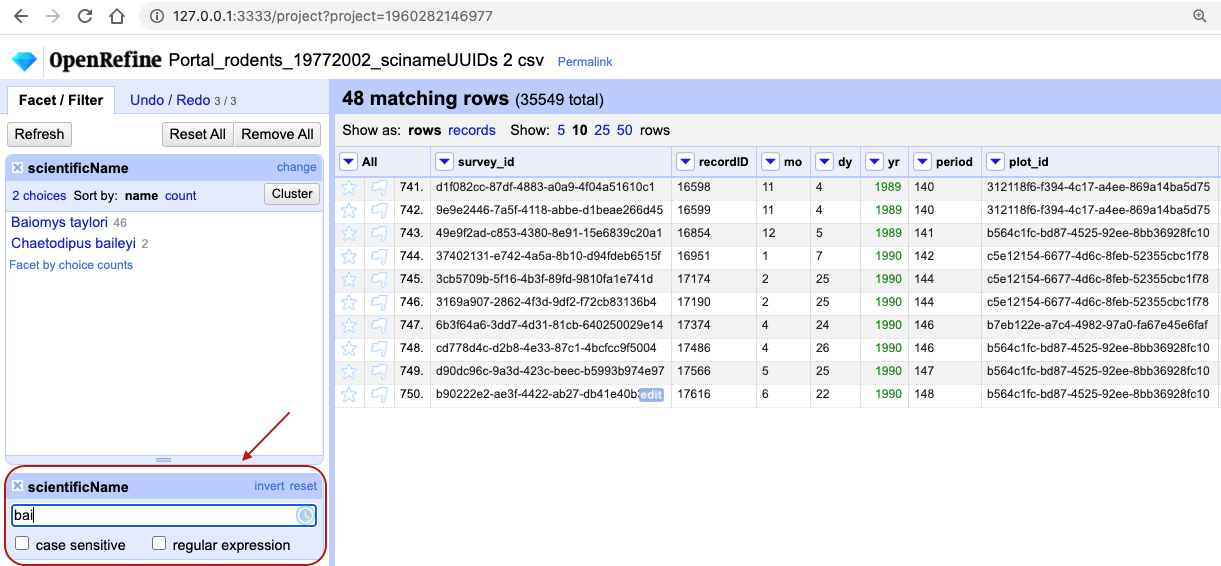
- Near the top of the screen, change
Show:to 50. This way, you will see all the matching rows in a single page.
Exercise
- What scientific names are selected by this text filter?
- How would you restrict it to one of the species selected?
Solution
- If you kept a text facet over
scientificNamefrom before - it will show that two names match your filter criteria are:Baiomys tayloriandChaetodipus baileyi. If you have closed the text facet, selectFacet>Text faceton thescientificNamecolumn to reinstate it.- There are various options to restrict to only one of the two species identified. You could make the search case sensitive. You could split the
scientificNamecolumn into species and genus columns, as before, and filter only the column of interest. You could include more letters in your filter, e.g.baiowhich would excludeChaetodipus baileyi. Try playing with these different options. You could include more letters in your filter, e.g.baiowhich would excludeChaetodipus baileyi. Try playing with these different options.
Important: Make sure both species are included in your filtered dataset before continuing with the rest of the exercises.
Filters vs. facets
Faceting and filtering look very similar. A good distinction is that faceting gives you an overview of all the data that is currently selected, while filtering allows you to select a subset of your data for further inspection and analysis.
Sorting data
Sorting data is a useful practice for detecting outliers in data - potential errors and blanks will sort to the top or the bottom of your data.
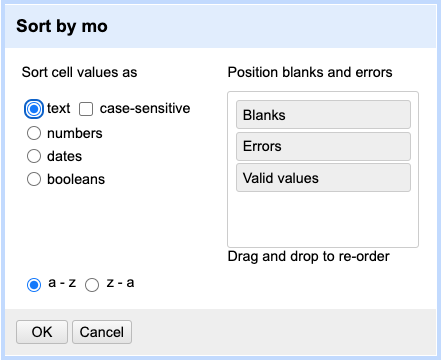
To sort the data in a column, click the arrow next to your chosen column name and select Sort.... This will open a pop-up
that will present you with different options, e.g. whether you wish to sort by text, numbers, dates or booleans
(i.e. TRUE or FALSE values). Additional options will appear to allow you to fine-tune your sorting - e.g. you can
specify where to place Blanks and Errors in the sorted results.
Exercise
Try sorting the data by month using the column
mo. What happens if you sort the column as text? How can you ensure that months are in order?Solution
From the drop-down menu on the column
moselectSortthenSort.... SelectSort cell values as textfirst. (Note that you can rearrangeErrors,BlanksandValid valuesso that errors and blanks will sort to the top. This is a good practice detect some outliers.)
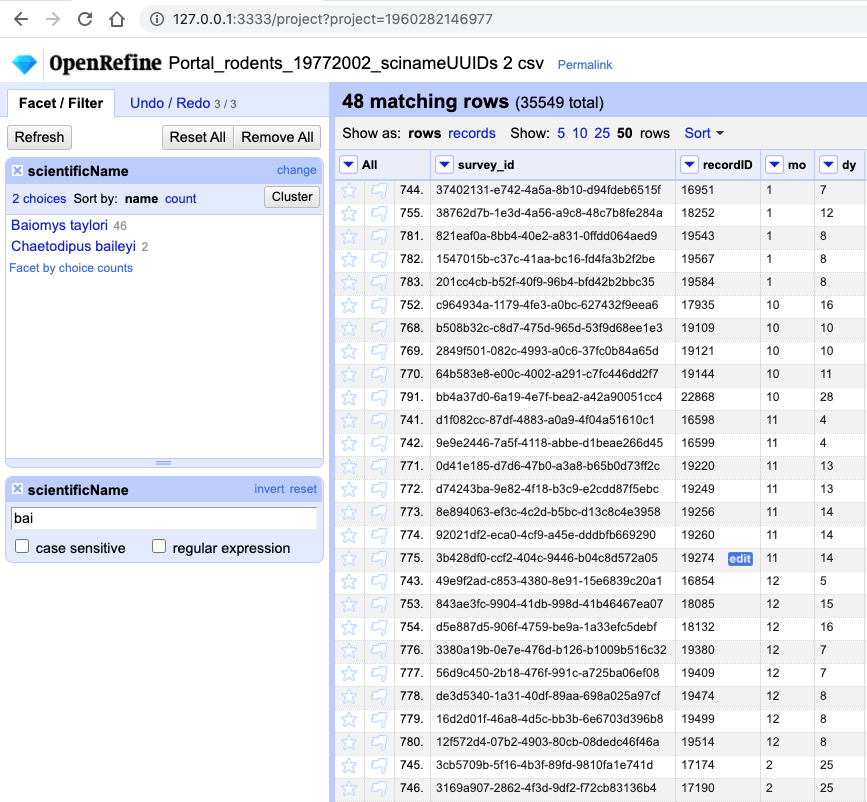
You will notice that values for month have been sorted in alphabetical order, where months 10, 11 and 12 came before month 2.
This is probably not what you wanted - so you will have to redo the sort and select the
Sort cell values as numberoption.You may have noticed that in the case of sorting as numbers, the actual column itself remained as text. OpenRefine did not convert the column to numbers (notice the absence of the green font).
Another thing to note is that sorting is not an action that you can undo/redo - it does not appear on Undo/Redo tab. This is because sorting only rearranges the order of the data, it doesn’t change its content. This means the sorting will not change the cells in a column from text to numbers - rather, it will interpret the values as numbers for the purposes of sorting, but will keep the underlying data type unchanged.
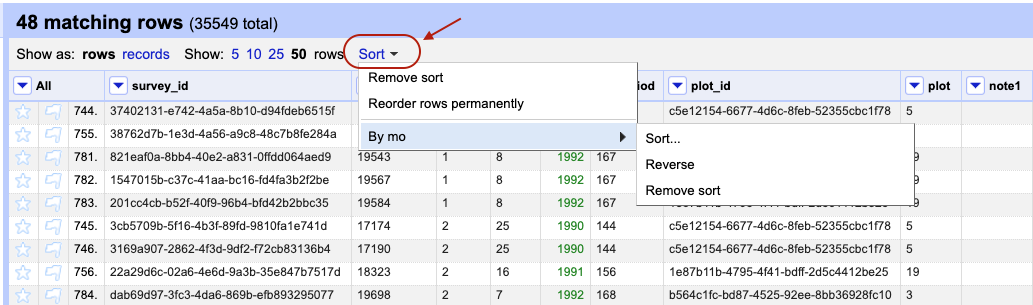
The first time you sort a column, the first option will present as Sort.... If you re-sort a column that you
have already sorted, the drop-down menu changes slightly: the first option will be Sort and the following sub-options
will be presented:
Sort...- This option enables you to choose a new sort.Reverse- This option allows you to reverse the order of the sort.Remove sort- This option allows you to undo your sort.
It may not always be that obvious in OpenRefine that you performed a sort. Once you complete the sort for the first time
a Sort button will appear at the top of the page as an indicator that the data has been sorted. It will disappear if
you remove the sort.
Exercise
Remove the sort by month. Make sure you still have the text filter for the text “bai” on the
scientificNamecolumn present (if you have lost your text filter for “bai” see the start of the episode to help you reinstate it). Then sort the data byplot. In which year(s) were observations recorded for plot 1 in the filtered dataset?Solution
From the drop-down menu on the column
plotselectSort...thenSort cell values as numbersandsmallest first. The years observations were recorded in plot 1 are 1990 and 1995.
Sorting by multiple columns
Once you have completed one sort, any further sort will be performed by default as an additional sort. For example, if
you take the data that has been sorted by plot and the sort by year, OpenRefine will present the data sorted by
plot and then by year. If you wish to restart the sorting process, check the sort by this column
alone box in the Sort pop-up menu.
Exercise
You might like to look for trends in your data by month of collection across years.
- How do you sort your data by month?
- How would you do this differently if you were instead trying to see all of your entries in chronological order?
Solution
- To sort by month, click on
Sort...from themocolumn, and then selectSort cell values as numbers. This will group all entries made in, for example, January, together, regardless of which year that entry was collected.- To sort chronologically, click on
Sort>Sort...from theyrcolumn , and then selectSort cell values as numbers. Before clicking ‘OK’ make sure you selectsort by this column aloneto start a new sort from scratch.- You can now apply an additional sort, this time by month (click on
Sortfrom themocolumn, and then selectSort cell values as numbers).- To ensure that all entries are shown chronologically, you will need to add a third sorting step to sort data by day (using the column
dy).
If you go back to one of the already sorted columns and select Sort > Remove sort, that column is removed from
your multiple sort. If it is the only column sorted, then the data revert to their original order.
Exercise
Sort by
year,monthanddayin some order. Be creative: try sorting asnumbersortext, and in reverse order (largest to smallestorz to a).Use
Sort>Remove sortto remove the sort on the second of three columns. Notice how that changes the order.
Sorting does not change data
You may have noticed that after any of the sorting steps there was nothing to undo/redo. This is because you have only reordered and not modified you data. If you want to revert to the original order of the data - make sure you remove all “sorts” using the
Sort>Remove sortoption.
Key Points
OpenRefine provides various ways to sort and filter data without affecting the raw data.