Opening and Exploring Data
Overview
Teaching: 20 min
Exercises: 15 minQuestions
How can we import our data into OpenRefine?
How can we summarise our data?
How can we find errors in our data?
How can we edit data to fix errors?
How can we convert column data from one data type to another?
Objectives
Create a new OpenRefine project from a CSV file.
Learn about different types of facets and how they can be used to summarise data of different data types.
Creating a project
Start OpenRefine, which will open in your browser (at the address http://127.0.0.0:3333). Once OpenRefine is launched in your
browser, the left margin has options to Create Project, Open Project, or Import Project. Here we will create a new
project and import our portal rodents data.
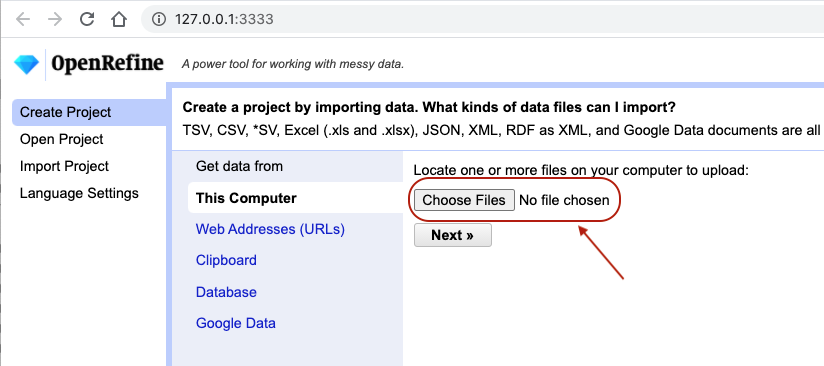
- Click
Create Projectfrom the left margin and select thenThis Computer(because you’re uploading data from your computer). - Click
Choose Filesand browse to where you stored the filePortal_rodents_19772002_scinameUUIDs.csv. Select the file and clickOpen, or just double-click on the filename. - Click
Next>>under the browse button to upload the data into OpenRefine. -
On the next screen, OpenRefine will present you with a preview of your data. You can check here for obvious errors, if, for example, your file was tab-delimited rather than comma-delimited, the preview would look strange (and you could correct it by choosing the correct separator and clicking the
Update Previewbutton on the right. If you selected the wrong file, click<<Start Overat the top left.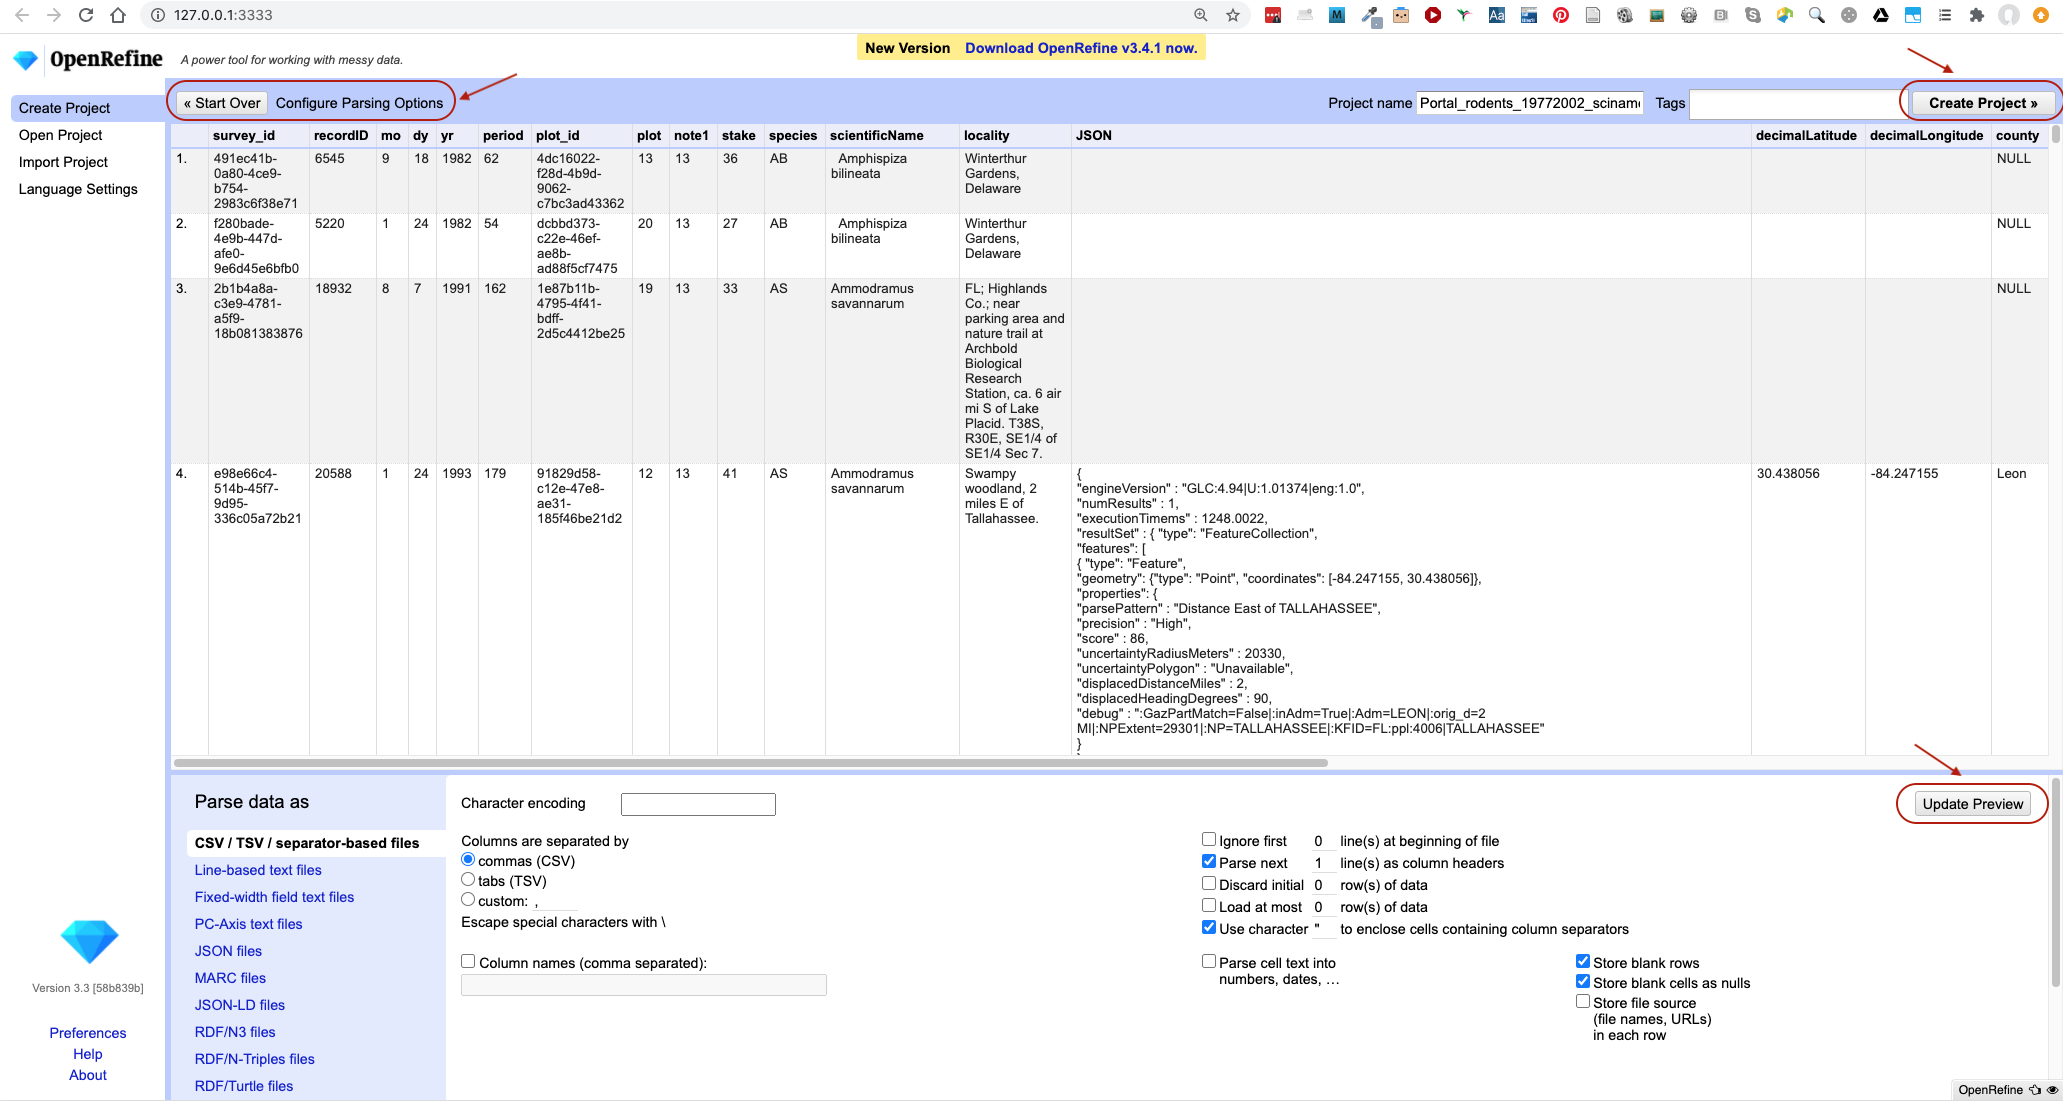
- In the middle of the page, will be a set of options (
Character encoding, etc.). Make sure the tick box next toTrim leading & trailing whitespace from stringsis not ticked. (We’re going to need the leading whitespace in one of our examples.) - If all looks well, click
Create Project>>in the top right. You will be presented with a view onto your data. This is OpenRefine!
Let’s now start exploring and getting a higher-level overview of our data - summarising and looking for potential outliers and errors.
Data file types supported
OpenRefine can import a variety of different file types, including tab separated (
tsv), comma separated (csv), Excel (xls,xlsx), JSON, XML, RDF as XML, and Google Spreadsheets. See the OpenRefine Importers page for more information.
Data faceting
Facets are one of the most useful features of OpenRefine. Data faceting is a process of exploring data by applying multiple filters to investigate its composition. It also allows you to identify a subset of data that you wish to change in bulk.
OpenRefine Wiki: Faceting
Full documentation on faceting can be found at OpenRefine Wiki: Faceting
OpenRefine supports a range of facets, including:
- Text facet for working with textual data,
- Numeric and Scatterplot facets for working with numeric data,
- Timeline facet for working with dates, and
- number of customized facets (some of which we will cover shortly).
Text facet
A ‘text facet’ groups all the identical text values in a column and lists each value with the number of records in which
it appears. The facet information always appears in the left hand panel in the OpenRefine interface. We will use text
faceting to look for potential errors in the scientificName column.
- Click the down arrow next to the
scientificNamecolumn. - Choose
Facet>Text facet. -
In the left panel, you’ll now see a box containing every unique value in the
scientificNamecolumn along with a number representing how many times that value occurs in the column.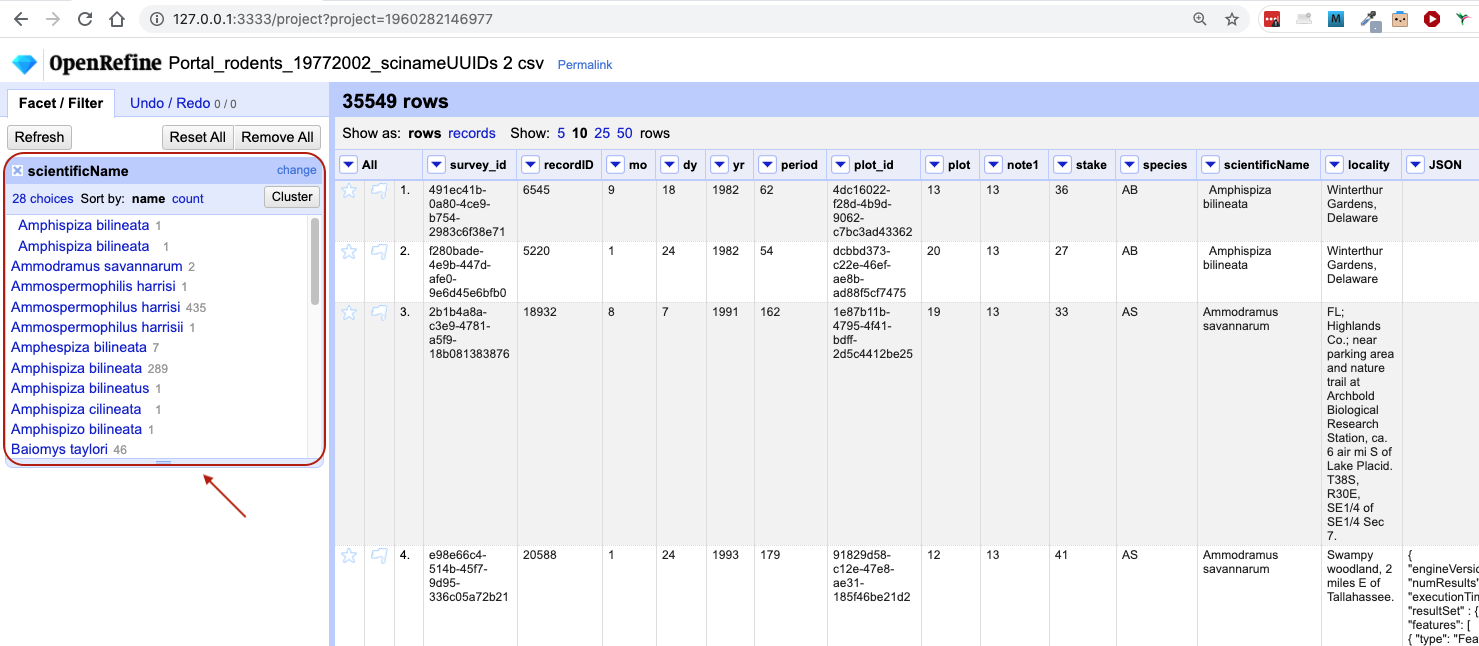
- You can click in this panel to sort the facet by
nameandcount. Do you notice any problems with the data? What are they? - Hover the mouse over any one of the names in the left panel. You should see that you have an
editfunction available. - You could use this to fix an error immediately, and OpenRefine will ask whether you want to make the same correction to every value equal to the one you identified. But OpenRefine offers even better ways to find and fix errors across the whole dataset, which we will use instead. We will learn about these when we talk about clustering.
There will be several near-identical entries in scientificName. For example, there is one entry for Ammospermophilis harrisi and
one entry for Ammospermophilus harrisii. These are both misspellings of Ammospermophilus harrisi. We will see how to correct these
misspelled and mistyped entries in a later exercise.
Exercise
Using faceting, find out how many years are represented in the census (via the
yrcolumn).Is the column formatted as a number, date or text?
Which year has the most and which year has the least observations?
Solution
- For the column
yrdoFacet>Text facet. A box will appear in the left panel showing that there are 26 unique entries in this column.- If you try to apply a Numeric facet on the same column, you may notice that it won’t work. This is because, by default, all columns in OpenRefine are formatted as text.
- You can change the data format to numbers by selecting the down arrow next to the
yrcolumn name, selectingEdit cells>Common transforms>To number. Notice when this change was applied that the values in the column changed from black to green, and from left-justified to right-justified. If you now selectFacet>Numeric faceton columnyr, a new box is created that shows a histogram of the number of entries per year. Notice that the data is shown as a number, not a date.- You can also transform the column data type to be date by selecting
Edit cells>Common transforms>To date. Note the program will assume all entries take place on 1st January of the year. You can now choose a Timeline facet. If you change the date to date data type, undo that action from the Undo/Redo tab to revert to the numeric data type before moving on to the next step. We will cover undoing/redoing actions in more detail shortly.- Click
Sort by countin the Text facet box to order the counts numerically. The year with the most observations is 1997, and the year with the least is 1977.
Default data type
Be default, all data imported in OpenRefine is treated as text. You have to tell OpenRefine explicitly to treat columns differently via
Edit cells>Common transforms, e.g. as numbers. If you change the data type - it will appear in green.
Facets for working with numbers
As we have seen in the previous exercise, when data is initially imported into OpenRefine,
all the columns are treated as text values. We have seen that we can
transform columns to other data types (e.g. number or date) using the Edit cells > Common transforms feature. Here
we will experiment more with changing columns to numbers to see what additional capabilities this grants us.
Transform cells in the recordID column to numbers by clicking the down arrow for the column, then Edit cells >
Common transforms… > To number. You will notice the recordID values change from left-justified to right-justified,
and from black to green.
Exercise
Transform more columns, e.g.
recordIDandyr, from text to numbers. Can all columns be transformed to numbers?Solution
To convert to number, a column must include only numerals (0-9). If you apply a number transformation to a column that does not meet this criterion (e.g.
scientificNamecolumn), you might get an error and no data will be transformed (you can check this under theUndo / Redotab: you will see the stage will be describedText transform on 0 cells.)
Facets for working with numbers, including numeric and scatterplot facets, display graphs instead of lists of values. These graphs include ‘drag and drop’ controls you can use to set a start and end range to filter the data displayed.
Numeric facet
Sometimes there are non-numeric values or blanks in a column which could represent errors in data entry. We can use
OpenRefine to find them with a Numeric facet. Remove the facets we created previously before you proceed to gain
more space.
-
For a column you have transformed to numbers, e.g.
recordID, edit one or two cells and replace the numbers with text (such asabc) or with a blank (i.e. no space, number or text). To do so, hover over the cell you want to modify and aneditbutton will appear. Click on it and you will be able to modify the cell’s value. If you receive an errorNot a valid number, try again and this time change theData Typein the edit box toText.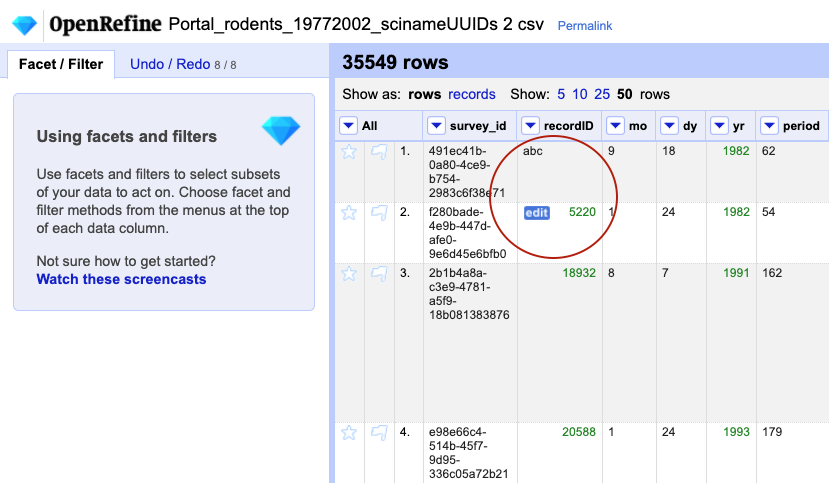
-
Now use the drop down menu next to the column name, select
Facet > Numeric facetto apply a numeric facet to the column you edited. The graph representing the numeric facet will appear in the left panel.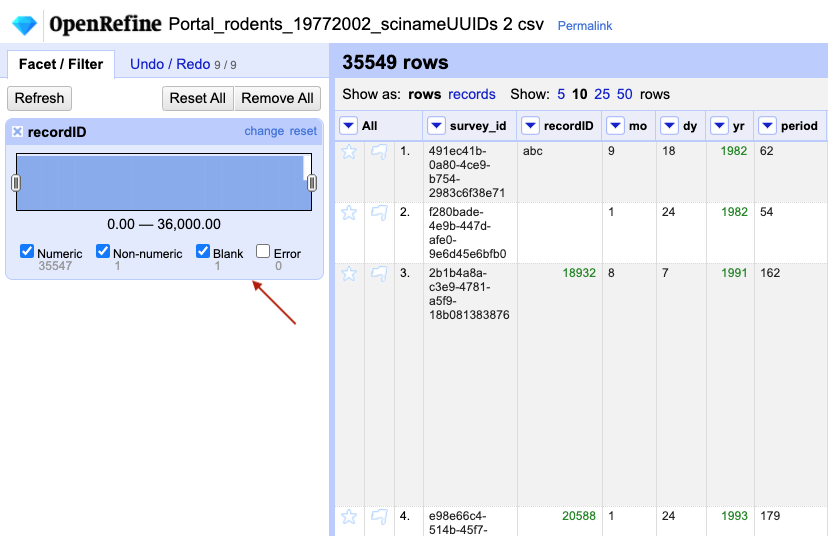
-
Notice that there are several checkboxes in this facet:
Numeric,Non-numeric,Blank, andError. Below these are counts showing the number of matching cells in each category. You should see checks forNon-numericandBlankif you changed some values.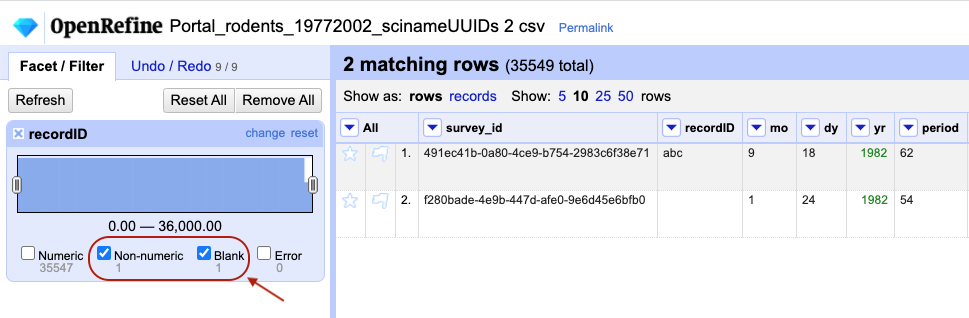
-
Experiment with checking or unchecking these boxes, and notice how this affects your data table.
When you have finished examining the numeric data, remove this facet by clicking the x in the upper left corner of its
panel. Note that this does not undo the edits you made to the cells in this column. If you want to reverse these edits,
use the Undo / Redo function.
Scatterplot facet
Now that we have multiple columns representing numbers, we can see how they relate to one another using the scatterplot facet.
Select a numeric column, for example recordID, and use the pulldown menu to > Facet > Scatterplot facet. A new
window called Scatterplot Matrix will appear. It contains grids for each pair of numeric columns that have been
plotted against each other (the number will vary
dependent on how many columns you have transformed to numbers).
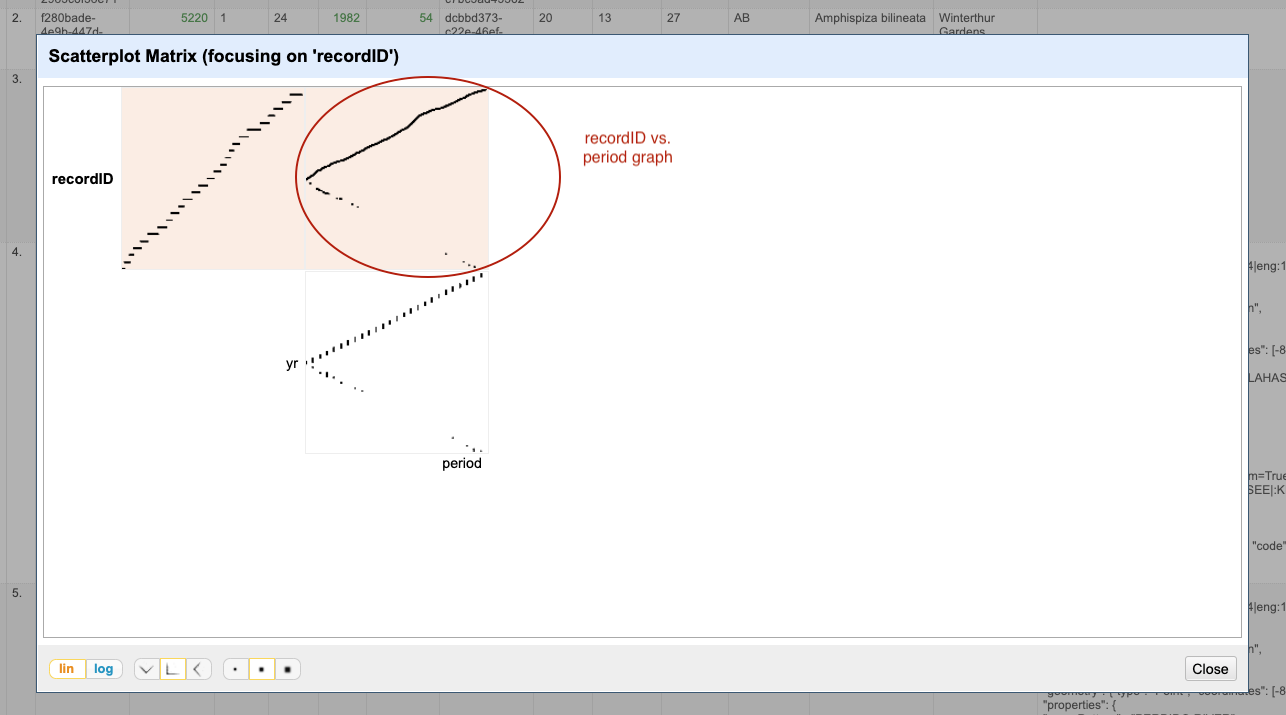
- Examine the scatterplots overall. Do the patterns make sense?
- Why does the scatterplot for
recordIDvsperiodhave the pattern it does?
We can examine one pair of columns by clicking on its square in the Scatterplot Matrix A new facet with only that pair
of columns will appear in the left margin as an interactive graph. Click in the scatterplot facet in the left margin and
drag to highlight a rectangle. This is a very powerful way of subsetting data of interest.
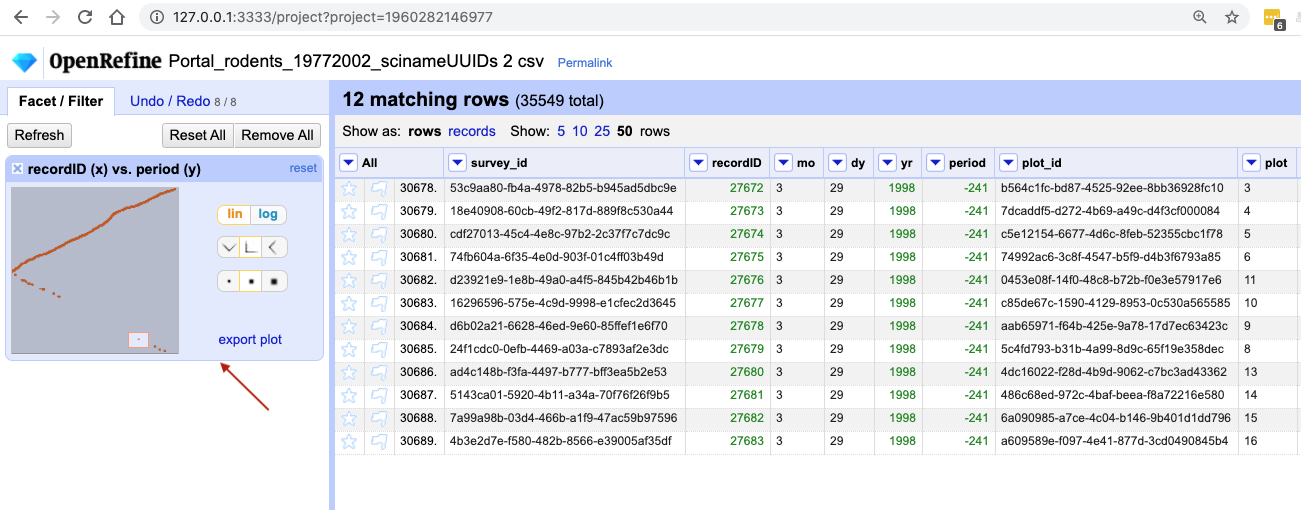
The scatterplot recordID vs period has a slightly unexpected shape - you would probably expect a
linear graph. Instead, there are some negative values on the period axis. These are potentially errors in the data.
You can click anywhere on the graph to get rid of the subsetting.
Other types of facets
In addition to Text, Numeric, Scatterplot and Timeline facets, OpenRefine also supports a range of customized facets:
- Word facet - this breaks down text into words and counts the number of records in which each word appears
- Duplicates facet - this results in a binary facet of ‘true’ or ‘false’. Rows appear in the ‘true’ facet if the value in the selected column is an exact match for a value in the same column in another row
- Text length facet - creates a numeric facet based on the length (number of characters) of the text in each row for the selected column. This can be useful for spotting incorrect or unusual data in a field where specific lengths are expected (e.g. if the values are expected to be years, any row with a text length more than 4 for that column is likely to be incorrect)
- Facet by blank - a binary facet of ‘true’ or ‘false’. Rows appear in the ‘true’ facet if they have no data present in that column. This is useful when looking for rows missing key data.
Facets are used to group together common values. OpenRefine limits the number of values allowed in a single facet to ensure the software does not perform slowly or run out of memory. If you create a facet where there are many unique values (for example, a facet on a ‘book title’ column in a data set that has one row per book) the facet created will be very large and may either slow down the application, or OpenRefine will refuse to create the facet.
Key Points
Faceting can identify errors or outliers in data.